- Privacy Policy
Home » Research Results Section – Writing Guide and Examples

Research Results Section – Writing Guide and Examples
Table of Contents

Research Results
Research results refer to the findings and conclusions derived from a systematic investigation or study conducted to answer a specific question or hypothesis. These results are typically presented in a written report or paper and can include various forms of data such as numerical data, qualitative data, statistics, charts, graphs, and visual aids.
Results Section in Research
The results section of the research paper presents the findings of the study. It is the part of the paper where the researcher reports the data collected during the study and analyzes it to draw conclusions.
In the results section, the researcher should describe the data that was collected, the statistical analysis performed, and the findings of the study. It is important to be objective and not interpret the data in this section. Instead, the researcher should report the data as accurately and objectively as possible.
Structure of Research Results Section
The structure of the research results section can vary depending on the type of research conducted, but in general, it should contain the following components:
- Introduction: The introduction should provide an overview of the study, its aims, and its research questions. It should also briefly explain the methodology used to conduct the study.
- Data presentation : This section presents the data collected during the study. It may include tables, graphs, or other visual aids to help readers better understand the data. The data presented should be organized in a logical and coherent way, with headings and subheadings used to help guide the reader.
- Data analysis: In this section, the data presented in the previous section are analyzed and interpreted. The statistical tests used to analyze the data should be clearly explained, and the results of the tests should be presented in a way that is easy to understand.
- Discussion of results : This section should provide an interpretation of the results of the study, including a discussion of any unexpected findings. The discussion should also address the study’s research questions and explain how the results contribute to the field of study.
- Limitations: This section should acknowledge any limitations of the study, such as sample size, data collection methods, or other factors that may have influenced the results.
- Conclusions: The conclusions should summarize the main findings of the study and provide a final interpretation of the results. The conclusions should also address the study’s research questions and explain how the results contribute to the field of study.
- Recommendations : This section may provide recommendations for future research based on the study’s findings. It may also suggest practical applications for the study’s results in real-world settings.
Outline of Research Results Section
The following is an outline of the key components typically included in the Results section:
I. Introduction
- A brief overview of the research objectives and hypotheses
- A statement of the research question
II. Descriptive statistics
- Summary statistics (e.g., mean, standard deviation) for each variable analyzed
- Frequencies and percentages for categorical variables
III. Inferential statistics
- Results of statistical analyses, including tests of hypotheses
- Tables or figures to display statistical results
IV. Effect sizes and confidence intervals
- Effect sizes (e.g., Cohen’s d, odds ratio) to quantify the strength of the relationship between variables
- Confidence intervals to estimate the range of plausible values for the effect size
V. Subgroup analyses
- Results of analyses that examined differences between subgroups (e.g., by gender, age, treatment group)
VI. Limitations and assumptions
- Discussion of any limitations of the study and potential sources of bias
- Assumptions made in the statistical analyses
VII. Conclusions
- A summary of the key findings and their implications
- A statement of whether the hypotheses were supported or not
- Suggestions for future research
Example of Research Results Section
An Example of a Research Results Section could be:
- This study sought to examine the relationship between sleep quality and academic performance in college students.
- Hypothesis : College students who report better sleep quality will have higher GPAs than those who report poor sleep quality.
- Methodology : Participants completed a survey about their sleep habits and academic performance.
II. Participants
- Participants were college students (N=200) from a mid-sized public university in the United States.
- The sample was evenly split by gender (50% female, 50% male) and predominantly white (85%).
- Participants were recruited through flyers and online advertisements.
III. Results
- Participants who reported better sleep quality had significantly higher GPAs (M=3.5, SD=0.5) than those who reported poor sleep quality (M=2.9, SD=0.6).
- See Table 1 for a summary of the results.
- Participants who reported consistent sleep schedules had higher GPAs than those with irregular sleep schedules.
IV. Discussion
- The results support the hypothesis that better sleep quality is associated with higher academic performance in college students.
- These findings have implications for college students, as prioritizing sleep could lead to better academic outcomes.
- Limitations of the study include self-reported data and the lack of control for other variables that could impact academic performance.
V. Conclusion
- College students who prioritize sleep may see a positive impact on their academic performance.
- These findings highlight the importance of sleep in academic success.
- Future research could explore interventions to improve sleep quality in college students.
Example of Research Results in Research Paper :
Our study aimed to compare the performance of three different machine learning algorithms (Random Forest, Support Vector Machine, and Neural Network) in predicting customer churn in a telecommunications company. We collected a dataset of 10,000 customer records, with 20 predictor variables and a binary churn outcome variable.
Our analysis revealed that all three algorithms performed well in predicting customer churn, with an overall accuracy of 85%. However, the Random Forest algorithm showed the highest accuracy (88%), followed by the Support Vector Machine (86%) and the Neural Network (84%).
Furthermore, we found that the most important predictor variables for customer churn were monthly charges, contract type, and tenure. Random Forest identified monthly charges as the most important variable, while Support Vector Machine and Neural Network identified contract type as the most important.
Overall, our results suggest that machine learning algorithms can be effective in predicting customer churn in a telecommunications company, and that Random Forest is the most accurate algorithm for this task.
Example 3 :
Title : The Impact of Social Media on Body Image and Self-Esteem
Abstract : This study aimed to investigate the relationship between social media use, body image, and self-esteem among young adults. A total of 200 participants were recruited from a university and completed self-report measures of social media use, body image satisfaction, and self-esteem.
Results: The results showed that social media use was significantly associated with body image dissatisfaction and lower self-esteem. Specifically, participants who reported spending more time on social media platforms had lower levels of body image satisfaction and self-esteem compared to those who reported less social media use. Moreover, the study found that comparing oneself to others on social media was a significant predictor of body image dissatisfaction and lower self-esteem.
Conclusion : These results suggest that social media use can have negative effects on body image satisfaction and self-esteem among young adults. It is important for individuals to be mindful of their social media use and to recognize the potential negative impact it can have on their mental health. Furthermore, interventions aimed at promoting positive body image and self-esteem should take into account the role of social media in shaping these attitudes and behaviors.
Importance of Research Results
Research results are important for several reasons, including:
- Advancing knowledge: Research results can contribute to the advancement of knowledge in a particular field, whether it be in science, technology, medicine, social sciences, or humanities.
- Developing theories: Research results can help to develop or modify existing theories and create new ones.
- Improving practices: Research results can inform and improve practices in various fields, such as education, healthcare, business, and public policy.
- Identifying problems and solutions: Research results can identify problems and provide solutions to complex issues in society, including issues related to health, environment, social justice, and economics.
- Validating claims : Research results can validate or refute claims made by individuals or groups in society, such as politicians, corporations, or activists.
- Providing evidence: Research results can provide evidence to support decision-making, policy-making, and resource allocation in various fields.
How to Write Results in A Research Paper
Here are some general guidelines on how to write results in a research paper:
- Organize the results section: Start by organizing the results section in a logical and coherent manner. Divide the section into subsections if necessary, based on the research questions or hypotheses.
- Present the findings: Present the findings in a clear and concise manner. Use tables, graphs, and figures to illustrate the data and make the presentation more engaging.
- Describe the data: Describe the data in detail, including the sample size, response rate, and any missing data. Provide relevant descriptive statistics such as means, standard deviations, and ranges.
- Interpret the findings: Interpret the findings in light of the research questions or hypotheses. Discuss the implications of the findings and the extent to which they support or contradict existing theories or previous research.
- Discuss the limitations : Discuss the limitations of the study, including any potential sources of bias or confounding factors that may have affected the results.
- Compare the results : Compare the results with those of previous studies or theoretical predictions. Discuss any similarities, differences, or inconsistencies.
- Avoid redundancy: Avoid repeating information that has already been presented in the introduction or methods sections. Instead, focus on presenting new and relevant information.
- Be objective: Be objective in presenting the results, avoiding any personal biases or interpretations.
When to Write Research Results
Here are situations When to Write Research Results”
- After conducting research on the chosen topic and obtaining relevant data, organize the findings in a structured format that accurately represents the information gathered.
- Once the data has been analyzed and interpreted, and conclusions have been drawn, begin the writing process.
- Before starting to write, ensure that the research results adhere to the guidelines and requirements of the intended audience, such as a scientific journal or academic conference.
- Begin by writing an abstract that briefly summarizes the research question, methodology, findings, and conclusions.
- Follow the abstract with an introduction that provides context for the research, explains its significance, and outlines the research question and objectives.
- The next section should be a literature review that provides an overview of existing research on the topic and highlights the gaps in knowledge that the current research seeks to address.
- The methodology section should provide a detailed explanation of the research design, including the sample size, data collection methods, and analytical techniques used.
- Present the research results in a clear and concise manner, using graphs, tables, and figures to illustrate the findings.
- Discuss the implications of the research results, including how they contribute to the existing body of knowledge on the topic and what further research is needed.
- Conclude the paper by summarizing the main findings, reiterating the significance of the research, and offering suggestions for future research.
Purpose of Research Results
The purposes of Research Results are as follows:
- Informing policy and practice: Research results can provide evidence-based information to inform policy decisions, such as in the fields of healthcare, education, and environmental regulation. They can also inform best practices in fields such as business, engineering, and social work.
- Addressing societal problems : Research results can be used to help address societal problems, such as reducing poverty, improving public health, and promoting social justice.
- Generating economic benefits : Research results can lead to the development of new products, services, and technologies that can create economic value and improve quality of life.
- Supporting academic and professional development : Research results can be used to support academic and professional development by providing opportunities for students, researchers, and practitioners to learn about new findings and methodologies in their field.
- Enhancing public understanding: Research results can help to educate the public about important issues and promote scientific literacy, leading to more informed decision-making and better public policy.
- Evaluating interventions: Research results can be used to evaluate the effectiveness of interventions, such as treatments, educational programs, and social policies. This can help to identify areas where improvements are needed and guide future interventions.
- Contributing to scientific progress: Research results can contribute to the advancement of science by providing new insights and discoveries that can lead to new theories, methods, and techniques.
- Informing decision-making : Research results can provide decision-makers with the information they need to make informed decisions. This can include decision-making at the individual, organizational, or governmental levels.
- Fostering collaboration : Research results can facilitate collaboration between researchers and practitioners, leading to new partnerships, interdisciplinary approaches, and innovative solutions to complex problems.
Advantages of Research Results
Some Advantages of Research Results are as follows:
- Improved decision-making: Research results can help inform decision-making in various fields, including medicine, business, and government. For example, research on the effectiveness of different treatments for a particular disease can help doctors make informed decisions about the best course of treatment for their patients.
- Innovation : Research results can lead to the development of new technologies, products, and services. For example, research on renewable energy sources can lead to the development of new and more efficient ways to harness renewable energy.
- Economic benefits: Research results can stimulate economic growth by providing new opportunities for businesses and entrepreneurs. For example, research on new materials or manufacturing techniques can lead to the development of new products and processes that can create new jobs and boost economic activity.
- Improved quality of life: Research results can contribute to improving the quality of life for individuals and society as a whole. For example, research on the causes of a particular disease can lead to the development of new treatments and cures, improving the health and well-being of millions of people.
About the author

Muhammad Hassan
Researcher, Academic Writer, Web developer
You may also like

Figures in Research Paper – Examples and Guide

Data Collection – Methods Types and Examples

Tables in Research Paper – Types, Creating Guide...

Table of Contents – Types, Formats, Examples

Survey Instruments – List and Their Uses

Evaluating Research – Process, Examples and...
- Research Process
- Manuscript Preparation
- Manuscript Review
- Publication Process
- Publication Recognition
- Language Editing Services
- Translation Services

How to write the results section of a research paper
- 3 minute read
- 71.4K views
Table of Contents
At its core, a research paper aims to fill a gap in the research on a given topic. As a result, the results section of the paper, which describes the key findings of the study, is often considered the core of the paper. This is the section that gets the most attention from reviewers, peers, students, and any news organization reporting on your findings. Writing a clear, concise, and logical results section is, therefore, one of the most important parts of preparing your manuscript.
Difference between results and discussion
Before delving into how to write the results section, it is important to first understand the difference between the results and discussion sections. The results section needs to detail the findings of the study. The aim of this section is not to draw connections between the different findings or to compare it to previous findings in literature—that is the purview of the discussion section. Unlike the discussion section, which can touch upon the hypothetical, the results section needs to focus on the purely factual. In some cases, it may even be preferable to club these two sections together into a single section. For example, while writing a review article, it can be worthwhile to club these two sections together, as the main results in this case are the conclusions that can be drawn from the literature.
Structure of the results section
Although the main purpose of the results section in a research paper is to report the findings, it is necessary to present an introduction and repeat the research question. This establishes a connection to the previous section of the paper and creates a smooth flow of information.
Next, the results section needs to communicate the findings of your research in a systematic manner. The section needs to be organized such that the primary research question is addressed first, then the secondary research questions. If the research addresses multiple questions, the results section must individually connect with each of the questions. This ensures clarity and minimizes confusion while reading.
Consider representing your results visually. For example, graphs, tables, and other figures can help illustrate the findings of your paper, especially if there is a large amount of data in the results.
Remember, an appealing results section can help peer reviewers better understand the merits of your research, thereby increasing your chances of publication.
Practical guidance for writing an effective results section for a research paper
- Always use simple and clear language. Avoid the use of uncertain or out-of-focus expressions.
- The findings of the study must be expressed in an objective and unbiased manner. While it is acceptable to correlate certain findings in the discussion section, it is best to avoid overinterpreting the results.
- If the research addresses more than one hypothesis, use sub-sections to describe the results. This prevents confusion and promotes understanding.
- Ensure that negative results are included in this section, even if they do not support the research hypothesis.
- Wherever possible, use illustrations like tables, figures, charts, or other visual representations to showcase the results of your research paper. Mention these illustrations in the text, but do not repeat the information that they convey.
- For statistical data, it is adequate to highlight the tests and explain their results. The initial or raw data should not be mentioned in the results section of a research paper.
The results section of a research paper is usually the most impactful section because it draws the greatest attention. Regardless of the subject of your research paper, a well-written results section is capable of generating interest in your research.
For detailed information and assistance on writing the results of a research paper, refer to Elsevier Author Services.

Writing a good review article

Why is data validation important in research?
You may also like.

Page-Turner Articles are More Than Just Good Arguments: Be Mindful of Tone and Structure!

A Must-see for Researchers! How to Ensure Inclusivity in Your Scientific Writing

Make Hook, Line, and Sinker: The Art of Crafting Engaging Introductions

Can Describing Study Limitations Improve the Quality of Your Paper?

A Guide to Crafting Shorter, Impactful Sentences in Academic Writing

6 Steps to Write an Excellent Discussion in Your Manuscript

How to Write Clear and Crisp Civil Engineering Papers? Here are 5 Key Tips to Consider

The Clear Path to An Impactful Paper: ②
Input your search keywords and press Enter.
Generate accurate APA citations for free
- Knowledge Base
- APA Style 7th edition
- How to write an APA results section
Reporting Research Results in APA Style | Tips & Examples
Published on December 21, 2020 by Pritha Bhandari . Revised on January 17, 2024.
The results section of a quantitative research paper is where you summarize your data and report the findings of any relevant statistical analyses.
The APA manual provides rigorous guidelines for what to report in quantitative research papers in the fields of psychology, education, and other social sciences.
Use these standards to answer your research questions and report your data analyses in a complete and transparent way.
Instantly correct all language mistakes in your text
Upload your document to correct all your mistakes in minutes

Table of contents
What goes in your results section, introduce your data, summarize your data, report statistical results, presenting numbers effectively, what doesn’t belong in your results section, frequently asked questions about results in apa.
In APA style, the results section includes preliminary information about the participants and data, descriptive and inferential statistics, and the results of any exploratory analyses.
Include these in your results section:
- Participant flow and recruitment period. Report the number of participants at every stage of the study, as well as the dates when recruitment took place.
- Missing data . Identify the proportion of data that wasn’t included in your final analysis and state the reasons.
- Any adverse events. Make sure to report any unexpected events or side effects (for clinical studies).
- Descriptive statistics . Summarize the primary and secondary outcomes of the study.
- Inferential statistics , including confidence intervals and effect sizes. Address the primary and secondary research questions by reporting the detailed results of your main analyses.
- Results of subgroup or exploratory analyses, if applicable. Place detailed results in supplementary materials.
Write up the results in the past tense because you’re describing the outcomes of a completed research study.
Are your APA in-text citations flawless?
The AI-powered APA Citation Checker points out every error, tells you exactly what’s wrong, and explains how to fix it. Say goodbye to losing marks on your assignment!
Get started!

Before diving into your research findings, first describe the flow of participants at every stage of your study and whether any data were excluded from the final analysis.
Participant flow and recruitment period
It’s necessary to report any attrition, which is the decline in participants at every sequential stage of a study. That’s because an uneven number of participants across groups sometimes threatens internal validity and makes it difficult to compare groups. Be sure to also state all reasons for attrition.
If your study has multiple stages (e.g., pre-test, intervention, and post-test) and groups (e.g., experimental and control groups), a flow chart is the best way to report the number of participants in each group per stage and reasons for attrition.
Also report the dates for when you recruited participants or performed follow-up sessions.
Missing data
Another key issue is the completeness of your dataset. It’s necessary to report both the amount and reasons for data that was missing or excluded.
Data can become unusable due to equipment malfunctions, improper storage, unexpected events, participant ineligibility, and so on. For each case, state the reason why the data were unusable.
Some data points may be removed from the final analysis because they are outliers—but you must be able to justify how you decided what to exclude.
If you applied any techniques for overcoming or compensating for lost data, report those as well.
Adverse events
For clinical studies, report all events with serious consequences or any side effects that occured.
Descriptive statistics summarize your data for the reader. Present descriptive statistics for each primary, secondary, and subgroup analysis.
Don’t provide formulas or citations for commonly used statistics (e.g., standard deviation) – but do provide them for new or rare equations.
Descriptive statistics
The exact descriptive statistics that you report depends on the types of data in your study. Categorical variables can be reported using proportions, while quantitative data can be reported using means and standard deviations . For a large set of numbers, a table is the most effective presentation format.
Include sample sizes (overall and for each group) as well as appropriate measures of central tendency and variability for the outcomes in your results section. For every point estimate , add a clearly labelled measure of variability as well.
Be sure to note how you combined data to come up with variables of interest. For every variable of interest, explain how you operationalized it.
According to APA journal standards, it’s necessary to report all relevant hypothesis tests performed, estimates of effect sizes, and confidence intervals.
When reporting statistical results, you should first address primary research questions before moving onto secondary research questions and any exploratory or subgroup analyses.
Present the results of tests in the order that you performed them—report the outcomes of main tests before post-hoc tests, for example. Don’t leave out any relevant results, even if they don’t support your hypothesis.
Inferential statistics
For each statistical test performed, first restate the hypothesis , then state whether your hypothesis was supported and provide the outcomes that led you to that conclusion.
Report the following for each hypothesis test:
- the test statistic value,
- the degrees of freedom ,
- the exact p- value (unless it is less than 0.001),
- the magnitude and direction of the effect.
When reporting complex data analyses, such as factor analysis or multivariate analysis, present the models estimated in detail, and state the statistical software used. Make sure to report any violations of statistical assumptions or problems with estimation.
Effect sizes and confidence intervals
For each hypothesis test performed, you should present confidence intervals and estimates of effect sizes .
Confidence intervals are useful for showing the variability around point estimates. They should be included whenever you report population parameter estimates.
Effect sizes indicate how impactful the outcomes of a study are. But since they are estimates, it’s recommended that you also provide confidence intervals of effect sizes.
Subgroup or exploratory analyses
Briefly report the results of any other planned or exploratory analyses you performed. These may include subgroup analyses as well.
Subgroup analyses come with a high chance of false positive results, because performing a large number of comparison or correlation tests increases the chances of finding significant results.
If you find significant results in these analyses, make sure to appropriately report them as exploratory (rather than confirmatory) results to avoid overstating their importance.
While these analyses can be reported in less detail in the main text, you can provide the full analyses in supplementary materials.
Prevent plagiarism. Run a free check.
To effectively present numbers, use a mix of text, tables , and figures where appropriate:
- To present three or fewer numbers, try a sentence ,
- To present between 4 and 20 numbers, try a table ,
- To present more than 20 numbers, try a figure .
Since these are general guidelines, use your own judgment and feedback from others for effective presentation of numbers.
Tables and figures should be numbered and have titles, along with relevant notes. Make sure to present data only once throughout the paper and refer to any tables and figures in the text.
Formatting statistics and numbers
It’s important to follow capitalization , italicization, and abbreviation rules when referring to statistics in your paper. There are specific format guidelines for reporting statistics in APA , as well as general rules about writing numbers .
If you are unsure of how to present specific symbols, look up the detailed APA guidelines or other papers in your field.
It’s important to provide a complete picture of your data analyses and outcomes in a concise way. For that reason, raw data and any interpretations of your results are not included in the results section.
It’s rarely appropriate to include raw data in your results section. Instead, you should always save the raw data securely and make them available and accessible to any other researchers who request them.
Making scientific research available to others is a key part of academic integrity and open science.
Interpretation or discussion of results
This belongs in your discussion section. Your results section is where you objectively report all relevant findings and leave them open for interpretation by readers.
While you should state whether the findings of statistical tests lend support to your hypotheses, refrain from forming conclusions to your research questions in the results section.
Explanation of how statistics tests work
For the sake of concise writing, you can safely assume that readers of your paper have professional knowledge of how statistical inferences work.
In an APA results section , you should generally report the following:
- Participant flow and recruitment period.
- Missing data and any adverse events.
- Descriptive statistics about your samples.
- Inferential statistics , including confidence intervals and effect sizes.
- Results of any subgroup or exploratory analyses, if applicable.
According to the APA guidelines, you should report enough detail on inferential statistics so that your readers understand your analyses.
- the test statistic value
- the degrees of freedom
- the exact p value (unless it is less than 0.001)
- the magnitude and direction of the effect
You should also present confidence intervals and estimates of effect sizes where relevant.
In APA style, statistics can be presented in the main text or as tables or figures . To decide how to present numbers, you can follow APA guidelines:
- To present three or fewer numbers, try a sentence,
- To present between 4 and 20 numbers, try a table,
- To present more than 20 numbers, try a figure.
Results are usually written in the past tense , because they are describing the outcome of completed actions.
The results chapter or section simply and objectively reports what you found, without speculating on why you found these results. The discussion interprets the meaning of the results, puts them in context, and explains why they matter.
In qualitative research , results and discussion are sometimes combined. But in quantitative research , it’s considered important to separate the objective results from your interpretation of them.
Cite this Scribbr article
If you want to cite this source, you can copy and paste the citation or click the “Cite this Scribbr article” button to automatically add the citation to our free Citation Generator.
Bhandari, P. (2024, January 17). Reporting Research Results in APA Style | Tips & Examples. Scribbr. Retrieved July 5, 2024, from https://www.scribbr.com/apa-style/results-section/
Is this article helpful?

Pritha Bhandari
Other students also liked, how to write an apa methods section, how to format tables and figures in apa style, reporting statistics in apa style | guidelines & examples, "i thought ai proofreading was useless but..".
I've been using Scribbr for years now and I know it's a service that won't disappoint. It does a good job spotting mistakes”
- Affiliate Program

- UNITED STATES
- 台灣 (TAIWAN)
- TÜRKIYE (TURKEY)
- Academic Editing Services
- - Research Paper
- - Journal Manuscript
- - Dissertation
- - College & University Assignments
- Admissions Editing Services
- - Application Essay
- - Personal Statement
- - Recommendation Letter
- - Cover Letter
- - CV/Resume
- Business Editing Services
- - Business Documents
- - Report & Brochure
- - Website & Blog
- Writer Editing Services
- - Script & Screenplay
- Our Editors
- Client Reviews
- Editing & Proofreading Prices
- Wordvice Points
- Partner Discount
- Plagiarism Checker
- APA Citation Generator
- MLA Citation Generator
- Chicago Citation Generator
- Vancouver Citation Generator
- - APA Style
- - MLA Style
- - Chicago Style
- - Vancouver Style
- Writing & Editing Guide
- Academic Resources
- Admissions Resources
How to Write the Results/Findings Section in Research
What is the research paper Results section and what does it do?
The Results section of a scientific research paper represents the core findings of a study derived from the methods applied to gather and analyze information. It presents these findings in a logical sequence without bias or interpretation from the author, setting up the reader for later interpretation and evaluation in the Discussion section. A major purpose of the Results section is to break down the data into sentences that show its significance to the research question(s).
The Results section appears third in the section sequence in most scientific papers. It follows the presentation of the Methods and Materials and is presented before the Discussion section —although the Results and Discussion are presented together in many journals. This section answers the basic question “What did you find in your research?”
What is included in the Results section?
The Results section should include the findings of your study and ONLY the findings of your study. The findings include:
- Data presented in tables, charts, graphs, and other figures (may be placed into the text or on separate pages at the end of the manuscript)
- A contextual analysis of this data explaining its meaning in sentence form
- All data that corresponds to the central research question(s)
- All secondary findings (secondary outcomes, subgroup analyses, etc.)
If the scope of the study is broad, or if you studied a variety of variables, or if the methodology used yields a wide range of different results, the author should present only those results that are most relevant to the research question stated in the Introduction section .
As a general rule, any information that does not present the direct findings or outcome of the study should be left out of this section. Unless the journal requests that authors combine the Results and Discussion sections, explanations and interpretations should be omitted from the Results.
How are the results organized?
The best way to organize your Results section is “logically.” One logical and clear method of organizing research results is to provide them alongside the research questions—within each research question, present the type of data that addresses that research question.
Let’s look at an example. Your research question is based on a survey among patients who were treated at a hospital and received postoperative care. Let’s say your first research question is:

“What do hospital patients over age 55 think about postoperative care?”
This can actually be represented as a heading within your Results section, though it might be presented as a statement rather than a question:
Attitudes towards postoperative care in patients over the age of 55
Now present the results that address this specific research question first. In this case, perhaps a table illustrating data from a survey. Likert items can be included in this example. Tables can also present standard deviations, probabilities, correlation matrices, etc.
Following this, present a content analysis, in words, of one end of the spectrum of the survey or data table. In our example case, start with the POSITIVE survey responses regarding postoperative care, using descriptive phrases. For example:
“Sixty-five percent of patients over 55 responded positively to the question “ Are you satisfied with your hospital’s postoperative care ?” (Fig. 2)
Include other results such as subcategory analyses. The amount of textual description used will depend on how much interpretation of tables and figures is necessary and how many examples the reader needs in order to understand the significance of your research findings.
Next, present a content analysis of another part of the spectrum of the same research question, perhaps the NEGATIVE or NEUTRAL responses to the survey. For instance:
“As Figure 1 shows, 15 out of 60 patients in Group A responded negatively to Question 2.”
After you have assessed the data in one figure and explained it sufficiently, move on to your next research question. For example:
“How does patient satisfaction correspond to in-hospital improvements made to postoperative care?”

This kind of data may be presented through a figure or set of figures (for instance, a paired T-test table).
Explain the data you present, here in a table, with a concise content analysis:
“The p-value for the comparison between the before and after groups of patients was .03% (Fig. 2), indicating that the greater the dissatisfaction among patients, the more frequent the improvements that were made to postoperative care.”
Let’s examine another example of a Results section from a study on plant tolerance to heavy metal stress . In the Introduction section, the aims of the study are presented as “determining the physiological and morphological responses of Allium cepa L. towards increased cadmium toxicity” and “evaluating its potential to accumulate the metal and its associated environmental consequences.” The Results section presents data showing how these aims are achieved in tables alongside a content analysis, beginning with an overview of the findings:
“Cadmium caused inhibition of root and leave elongation, with increasing effects at higher exposure doses (Fig. 1a-c).”
The figure containing this data is cited in parentheses. Note that this author has combined three graphs into one single figure. Separating the data into separate graphs focusing on specific aspects makes it easier for the reader to assess the findings, and consolidating this information into one figure saves space and makes it easy to locate the most relevant results.

Following this overall summary, the relevant data in the tables is broken down into greater detail in text form in the Results section.
- “Results on the bio-accumulation of cadmium were found to be the highest (17.5 mg kgG1) in the bulb, when the concentration of cadmium in the solution was 1×10G2 M and lowest (0.11 mg kgG1) in the leaves when the concentration was 1×10G3 M.”
Captioning and Referencing Tables and Figures
Tables and figures are central components of your Results section and you need to carefully think about the most effective way to use graphs and tables to present your findings . Therefore, it is crucial to know how to write strong figure captions and to refer to them within the text of the Results section.
The most important advice one can give here as well as throughout the paper is to check the requirements and standards of the journal to which you are submitting your work. Every journal has its own design and layout standards, which you can find in the author instructions on the target journal’s website. Perusing a journal’s published articles will also give you an idea of the proper number, size, and complexity of your figures.
Regardless of which format you use, the figures should be placed in the order they are referenced in the Results section and be as clear and easy to understand as possible. If there are multiple variables being considered (within one or more research questions), it can be a good idea to split these up into separate figures. Subsequently, these can be referenced and analyzed under separate headings and paragraphs in the text.
To create a caption, consider the research question being asked and change it into a phrase. For instance, if one question is “Which color did participants choose?”, the caption might be “Color choice by participant group.” Or in our last research paper example, where the question was “What is the concentration of cadmium in different parts of the onion after 14 days?” the caption reads:
“Fig. 1(a-c): Mean concentration of Cd determined in (a) bulbs, (b) leaves, and (c) roots of onions after a 14-day period.”
Steps for Composing the Results Section
Because each study is unique, there is no one-size-fits-all approach when it comes to designing a strategy for structuring and writing the section of a research paper where findings are presented. The content and layout of this section will be determined by the specific area of research, the design of the study and its particular methodologies, and the guidelines of the target journal and its editors. However, the following steps can be used to compose the results of most scientific research studies and are essential for researchers who are new to preparing a manuscript for publication or who need a reminder of how to construct the Results section.
Step 1 : Consult the guidelines or instructions that the target journal or publisher provides authors and read research papers it has published, especially those with similar topics, methods, or results to your study.
- The guidelines will generally outline specific requirements for the results or findings section, and the published articles will provide sound examples of successful approaches.
- Note length limitations on restrictions on content. For instance, while many journals require the Results and Discussion sections to be separate, others do not—qualitative research papers often include results and interpretations in the same section (“Results and Discussion”).
- Reading the aims and scope in the journal’s “ guide for authors ” section and understanding the interests of its readers will be invaluable in preparing to write the Results section.
Step 2 : Consider your research results in relation to the journal’s requirements and catalogue your results.
- Focus on experimental results and other findings that are especially relevant to your research questions and objectives and include them even if they are unexpected or do not support your ideas and hypotheses.
- Catalogue your findings—use subheadings to streamline and clarify your report. This will help you avoid excessive and peripheral details as you write and also help your reader understand and remember your findings. Create appendices that might interest specialists but prove too long or distracting for other readers.
- Decide how you will structure of your results. You might match the order of the research questions and hypotheses to your results, or you could arrange them according to the order presented in the Methods section. A chronological order or even a hierarchy of importance or meaningful grouping of main themes or categories might prove effective. Consider your audience, evidence, and most importantly, the objectives of your research when choosing a structure for presenting your findings.
Step 3 : Design figures and tables to present and illustrate your data.
- Tables and figures should be numbered according to the order in which they are mentioned in the main text of the paper.
- Information in figures should be relatively self-explanatory (with the aid of captions), and their design should include all definitions and other information necessary for readers to understand the findings without reading all of the text.
- Use tables and figures as a focal point to tell a clear and informative story about your research and avoid repeating information. But remember that while figures clarify and enhance the text, they cannot replace it.
Step 4 : Draft your Results section using the findings and figures you have organized.
- The goal is to communicate this complex information as clearly and precisely as possible; precise and compact phrases and sentences are most effective.
- In the opening paragraph of this section, restate your research questions or aims to focus the reader’s attention to what the results are trying to show. It is also a good idea to summarize key findings at the end of this section to create a logical transition to the interpretation and discussion that follows.
- Try to write in the past tense and the active voice to relay the findings since the research has already been done and the agent is usually clear. This will ensure that your explanations are also clear and logical.
- Make sure that any specialized terminology or abbreviation you have used here has been defined and clarified in the Introduction section .
Step 5 : Review your draft; edit and revise until it reports results exactly as you would like to have them reported to your readers.
- Double-check the accuracy and consistency of all the data, as well as all of the visual elements included.
- Read your draft aloud to catch language errors (grammar, spelling, and mechanics), awkward phrases, and missing transitions.
- Ensure that your results are presented in the best order to focus on objectives and prepare readers for interpretations, valuations, and recommendations in the Discussion section . Look back over the paper’s Introduction and background while anticipating the Discussion and Conclusion sections to ensure that the presentation of your results is consistent and effective.
- Consider seeking additional guidance on your paper. Find additional readers to look over your Results section and see if it can be improved in any way. Peers, professors, or qualified experts can provide valuable insights.
One excellent option is to use a professional English proofreading and editing service such as Wordvice, including our paper editing service . With hundreds of qualified editors from dozens of scientific fields, Wordvice has helped thousands of authors revise their manuscripts and get accepted into their target journals. Read more about the proofreading and editing process before proceeding with getting academic editing services and manuscript editing services for your manuscript.
As the representation of your study’s data output, the Results section presents the core information in your research paper. By writing with clarity and conciseness and by highlighting and explaining the crucial findings of their study, authors increase the impact and effectiveness of their research manuscripts.
For more articles and videos on writing your research manuscript, visit Wordvice’s Resources page.
Wordvice Resources
- How to Write a Research Paper Introduction
- Which Verb Tenses to Use in a Research Paper
- How to Write an Abstract for a Research Paper
- How to Write a Research Paper Title
- Useful Phrases for Academic Writing
- Common Transition Terms in Academic Papers
- Active and Passive Voice in Research Papers
- 100+ Verbs That Will Make Your Research Writing Amazing
- Tips for Paraphrasing in Research Papers
- USC Libraries
- Research Guides
Organizing Your Social Sciences Research Paper
- 7. The Results
- Purpose of Guide
- Design Flaws to Avoid
- Independent and Dependent Variables
- Glossary of Research Terms
- Reading Research Effectively
- Narrowing a Topic Idea
- Broadening a Topic Idea
- Extending the Timeliness of a Topic Idea
- Academic Writing Style
- Applying Critical Thinking
- Choosing a Title
- Making an Outline
- Paragraph Development
- Research Process Video Series
- Executive Summary
- The C.A.R.S. Model
- Background Information
- The Research Problem/Question
- Theoretical Framework
- Citation Tracking
- Content Alert Services
- Evaluating Sources
- Primary Sources
- Secondary Sources
- Tiertiary Sources
- Scholarly vs. Popular Publications
- Qualitative Methods
- Quantitative Methods
- Insiderness
- Using Non-Textual Elements
- Limitations of the Study
- Common Grammar Mistakes
- Writing Concisely
- Avoiding Plagiarism
- Footnotes or Endnotes?
- Further Readings
- Generative AI and Writing
- USC Libraries Tutorials and Other Guides
- Bibliography
The results section is where you report the findings of your study based upon the methodology [or methodologies] you applied to gather information. The results section should state the findings of the research arranged in a logical sequence without bias or interpretation. A section describing results should be particularly detailed if your paper includes data generated from your own research.
Annesley, Thomas M. "Show Your Cards: The Results Section and the Poker Game." Clinical Chemistry 56 (July 2010): 1066-1070.
Importance of a Good Results Section
When formulating the results section, it's important to remember that the results of a study do not prove anything . Findings can only confirm or reject the hypothesis underpinning your study. However, the act of articulating the results helps you to understand the problem from within, to break it into pieces, and to view the research problem from various perspectives.
The page length of this section is set by the amount and types of data to be reported . Be concise. Use non-textual elements appropriately, such as figures and tables, to present findings more effectively. In deciding what data to describe in your results section, you must clearly distinguish information that would normally be included in a research paper from any raw data or other content that could be included as an appendix. In general, raw data that has not been summarized should not be included in the main text of your paper unless requested to do so by your professor.
Avoid providing data that is not critical to answering the research question . The background information you described in the introduction section should provide the reader with any additional context or explanation needed to understand the results. A good strategy is to always re-read the background section of your paper after you have written up your results to ensure that the reader has enough context to understand the results [and, later, how you interpreted the results in the discussion section of your paper that follows].
Bavdekar, Sandeep B. and Sneha Chandak. "Results: Unraveling the Findings." Journal of the Association of Physicians of India 63 (September 2015): 44-46; Brett, Paul. "A Genre Analysis of the Results Section of Sociology Articles." English for Specific Speakers 13 (1994): 47-59; Go to English for Specific Purposes on ScienceDirect;Burton, Neil et al. Doing Your Education Research Project . Los Angeles, CA: SAGE, 2008; Results. The Structure, Format, Content, and Style of a Journal-Style Scientific Paper. Department of Biology. Bates College; Kretchmer, Paul. Twelve Steps to Writing an Effective Results Section. San Francisco Edit; "Reporting Findings." In Making Sense of Social Research Malcolm Williams, editor. (London;: SAGE Publications, 2003) pp. 188-207.
Structure and Writing Style
I. Organization and Approach
For most research papers in the social and behavioral sciences, there are two possible ways of organizing the results . Both approaches are appropriate in how you report your findings, but use only one approach.
- Present a synopsis of the results followed by an explanation of key findings . This approach can be used to highlight important findings. For example, you may have noticed an unusual correlation between two variables during the analysis of your findings. It is appropriate to highlight this finding in the results section. However, speculating as to why this correlation exists and offering a hypothesis about what may be happening belongs in the discussion section of your paper.
- Present a result and then explain it, before presenting the next result then explaining it, and so on, then end with an overall synopsis . This is the preferred approach if you have multiple results of equal significance. It is more common in longer papers because it helps the reader to better understand each finding. In this model, it is helpful to provide a brief conclusion that ties each of the findings together and provides a narrative bridge to the discussion section of the your paper.
NOTE: Just as the literature review should be arranged under conceptual categories rather than systematically describing each source, you should also organize your findings under key themes related to addressing the research problem. This can be done under either format noted above [i.e., a thorough explanation of the key results or a sequential, thematic description and explanation of each finding].
II. Content
In general, the content of your results section should include the following:
- Introductory context for understanding the results by restating the research problem underpinning your study . This is useful in re-orientating the reader's focus back to the research problem after having read a review of the literature and your explanation of the methods used for gathering and analyzing information.
- Inclusion of non-textual elements, such as, figures, charts, photos, maps, tables, etc. to further illustrate key findings, if appropriate . Rather than relying entirely on descriptive text, consider how your findings can be presented visually. This is a helpful way of condensing a lot of data into one place that can then be referred to in the text. Consider referring to appendices if there is a lot of non-textual elements.
- A systematic description of your results, highlighting for the reader observations that are most relevant to the topic under investigation . Not all results that emerge from the methodology used to gather information may be related to answering the " So What? " question. Do not confuse observations with interpretations; observations in this context refers to highlighting important findings you discovered through a process of reviewing prior literature and gathering data.
- The page length of your results section is guided by the amount and types of data to be reported . However, focus on findings that are important and related to addressing the research problem. It is not uncommon to have unanticipated results that are not relevant to answering the research question. This is not to say that you don't acknowledge tangential findings and, in fact, can be referred to as areas for further research in the conclusion of your paper. However, spending time in the results section describing tangential findings clutters your overall results section and distracts the reader.
- A short paragraph that concludes the results section by synthesizing the key findings of the study . Highlight the most important findings you want readers to remember as they transition into the discussion section. This is particularly important if, for example, there are many results to report, the findings are complicated or unanticipated, or they are impactful or actionable in some way [i.e., able to be pursued in a feasible way applied to practice].
NOTE: Always use the past tense when referring to your study's findings. Reference to findings should always be described as having already happened because the method used to gather the information has been completed.
III. Problems to Avoid
When writing the results section, avoid doing the following :
- Discussing or interpreting your results . Save this for the discussion section of your paper, although where appropriate, you should compare or contrast specific results to those found in other studies [e.g., "Similar to the work of Smith [1990], one of the findings of this study is the strong correlation between motivation and academic achievement...."].
- Reporting background information or attempting to explain your findings. This should have been done in your introduction section, but don't panic! Often the results of a study point to the need for additional background information or to explain the topic further, so don't think you did something wrong. Writing up research is rarely a linear process. Always revise your introduction as needed.
- Ignoring negative results . A negative result generally refers to a finding that does not support the underlying assumptions of your study. Do not ignore them. Document these findings and then state in your discussion section why you believe a negative result emerged from your study. Note that negative results, and how you handle them, can give you an opportunity to write a more engaging discussion section, therefore, don't be hesitant to highlight them.
- Including raw data or intermediate calculations . Ask your professor if you need to include any raw data generated by your study, such as transcripts from interviews or data files. If raw data is to be included, place it in an appendix or set of appendices that are referred to in the text.
- Be as factual and concise as possible in reporting your findings . Do not use phrases that are vague or non-specific, such as, "appeared to be greater than other variables..." or "demonstrates promising trends that...." Subjective modifiers should be explained in the discussion section of the paper [i.e., why did one variable appear greater? Or, how does the finding demonstrate a promising trend?].
- Presenting the same data or repeating the same information more than once . If you want to highlight a particular finding, it is appropriate to do so in the results section. However, you should emphasize its significance in relation to addressing the research problem in the discussion section. Do not repeat it in your results section because you can do that in the conclusion of your paper.
- Confusing figures with tables . Be sure to properly label any non-textual elements in your paper. Don't call a chart an illustration or a figure a table. If you are not sure, go here .
Annesley, Thomas M. "Show Your Cards: The Results Section and the Poker Game." Clinical Chemistry 56 (July 2010): 1066-1070; Bavdekar, Sandeep B. and Sneha Chandak. "Results: Unraveling the Findings." Journal of the Association of Physicians of India 63 (September 2015): 44-46; Burton, Neil et al. Doing Your Education Research Project . Los Angeles, CA: SAGE, 2008; Caprette, David R. Writing Research Papers. Experimental Biosciences Resources. Rice University; Hancock, Dawson R. and Bob Algozzine. Doing Case Study Research: A Practical Guide for Beginning Researchers . 2nd ed. New York: Teachers College Press, 2011; Introduction to Nursing Research: Reporting Research Findings. Nursing Research: Open Access Nursing Research and Review Articles. (January 4, 2012); Kretchmer, Paul. Twelve Steps to Writing an Effective Results Section. San Francisco Edit ; Ng, K. H. and W. C. Peh. "Writing the Results." Singapore Medical Journal 49 (2008): 967-968; Reporting Research Findings. Wilder Research, in partnership with the Minnesota Department of Human Services. (February 2009); Results. The Structure, Format, Content, and Style of a Journal-Style Scientific Paper. Department of Biology. Bates College; Schafer, Mickey S. Writing the Results. Thesis Writing in the Sciences. Course Syllabus. University of Florida.
Writing Tip
Why Don't I Just Combine the Results Section with the Discussion Section?
It's not unusual to find articles in scholarly social science journals where the author(s) have combined a description of the findings with a discussion about their significance and implications. You could do this. However, if you are inexperienced writing research papers, consider creating two distinct sections for each section in your paper as a way to better organize your thoughts and, by extension, your paper. Think of the results section as the place where you report what your study found; think of the discussion section as the place where you interpret the information and answer the "So What?" question. As you become more skilled writing research papers, you can consider melding the results of your study with a discussion of its implications.
Driscoll, Dana Lynn and Aleksandra Kasztalska. Writing the Experimental Report: Methods, Results, and Discussion. The Writing Lab and The OWL. Purdue University.
- << Previous: Insiderness
- Next: Using Non-Textual Elements >>
- Last Updated: Jul 3, 2024 10:07 AM
- URL: https://libguides.usc.edu/writingguide

- Langson Library
- Science Library
- Grunigen Medical Library
- Law Library
- Connect From Off-Campus
- Accessibility
- Gateway Study Center
Email this link
Writing a scientific paper.
- Writing a lab report
- INTRODUCTION
Writing a "good" results section
Figures and Captions in Lab Reports
"Results Checklist" from: How to Write a Good Scientific Paper. Chris A. Mack. SPIE. 2018.
Additional tips for results sections.
- LITERATURE CITED
- Bibliography of guides to scientific writing and presenting
- Peer Review
- Presentations
- Lab Report Writing Guides on the Web
This is the core of the paper. Don't start the results sections with methods you left out of the Materials and Methods section. You need to give an overall description of the experiments and present the data you found.
- Factual statements supported by evidence. Short and sweet without excess words
- Present representative data rather than endlessly repetitive data
- Discuss variables only if they had an effect (positive or negative)
- Use meaningful statistics
- Avoid redundancy. If it is in the tables or captions you may not need to repeat it
A short article by Dr. Brett Couch and Dr. Deena Wassenberg, Biology Program, University of Minnesota
- Present the results of the paper, in logical order, using tables and graphs as necessary.
- Explain the results and show how they help to answer the research questions posed in the Introduction. Evidence does not explain itself; the results must be presented and then explained.
- Avoid: presenting results that are never discussed; presenting results in chronological order rather than logical order; ignoring results that do not support the conclusions;
- Number tables and figures separately beginning with 1 (i.e. Table 1, Table 2, Figure 1, etc.).
- Do not attempt to evaluate the results in this section. Report only what you found; hold all discussion of the significance of the results for the Discussion section.
- It is not necessary to describe every step of your statistical analyses. Scientists understand all about null hypotheses, rejection rules, and so forth and do not need to be reminded of them. Just say something like, "Honeybees did not use the flowers in proportion to their availability (X2 = 7.9, p<0.05, d.f.= 4, chi-square test)." Likewise, cite tables and figures without describing in detail how the data were manipulated. Explanations of this sort should appear in a legend or caption written on the same page as the figure or table.
- You must refer in the text to each figure or table you include in your paper.
- Tables generally should report summary-level data, such as means ± standard deviations, rather than all your raw data. A long list of all your individual observations will mean much less than a few concise, easy-to-read tables or figures that bring out the main findings of your study.
- Only use a figure (graph) when the data lend themselves to a good visual representation. Avoid using figures that show too many variables or trends at once, because they can be hard to understand.
From: https://writingcenter.gmu.edu/guides/imrad-results-discussion
- << Previous: METHODS
- Next: DISCUSSION >>
- Last Updated: Aug 4, 2023 9:33 AM
- URL: https://guides.lib.uci.edu/scientificwriting
Off-campus? Please use the Software VPN and choose the group UCIFull to access licensed content. For more information, please Click here
Software VPN is not available for guests, so they may not have access to some content when connecting from off-campus.
- Bipolar Disorder
- Therapy Center
- When To See a Therapist
- Types of Therapy
- Best Online Therapy
- Best Couples Therapy
- Best Family Therapy
- Managing Stress
- Sleep and Dreaming
- Understanding Emotions
- Self-Improvement
- Healthy Relationships
- Student Resources
- Personality Types
- Guided Meditations
- Verywell Mind Insights
- 2024 Verywell Mind 25
- Mental Health in the Classroom
- Editorial Process
- Meet Our Review Board
- Crisis Support
How to Write an APA Results Section
Kendra Cherry, MS, is a psychosocial rehabilitation specialist, psychology educator, and author of the "Everything Psychology Book."
:max_bytes(150000):strip_icc():format(webp)/IMG_9791-89504ab694d54b66bbd72cb84ffb860e.jpg "writing results section research paper")
Emily is a board-certified science editor who has worked with top digital publishing brands like Voices for Biodiversity, Study.com, GoodTherapy, Vox, and Verywell.
:max_bytes(150000):strip_icc():format(webp)/Emily-Swaim-1000-0f3197de18f74329aeffb690a177160c.jpg "writing results section research paper")
Verywell / Nusha Ashjaee
What to Include in an APA Results Section
- Justify Claims
- Summarize Results
Report All Relevant Results
- Report Statistical Findings
Include Tables and Figures
What not to include in an apa results section.
Psychology papers generally follow a specific structure. One important section of a paper is known as the results section. An APA results section of a psychology paper summarizes the data that was collected and the statistical analyses that were performed. The goal of this section is to report the results of your study or experiment without any type of subjective interpretation.
At a Glance
The results section is a vital part of an APA paper that summarizes a study's findings and statistical analysis. This section often includes descriptive text, tables, and figures to help summarize the findings.
The focus is purely on summarizing and presenting the findings and should not include any interpretation, since you'll cover that in the subsequent discussion section.
This article covers how to write an APA results section, including what to include and what to avoid.
The results section is the third section of a psychology paper. It will appear after the introduction and methods sections and before the discussion section.
The results section should include:
- A summary of the research findings.
- Information about participant flow, recruitment , retention, and attrition. If some participants started the study and later left or failed to complete the study, then this should be described.
- Information about any reasons why some data might have been excluded from the study.
- Statistical information including samples sizes and statistical tests that were used. It should report standard deviations, p-values, and other measures of interest.
Results Should Justify Your Claims
Report data in order to sufficiently justify your conclusions. Since you'll be talking about your own interpretation of the results in the discussion section, you need to be sure that the information reported in the results section justifies your claims.
When you start writing your discussion section, you can then look back on your results to ensure that all the data you need are there to fully support your conclusions. Be sure not to make claims in your discussion section that are not supported by the findings described in your results section.
Summarize Your Results
Remember, you are summarizing the results of your psychological study, not reporting them in full detail. The results section should be a relatively brief overview of your findings, not a complete presentation of every single number and calculation.
If you choose, you can create a supplemental online archive where other researchers can access the raw data if they choose.
How long should a results section be?
The length of your results section will vary depending on the nature of your paper and the complexity of your research. In most cases, this will be the shortest section of your paper.
Just as the results section of your psychology paper should sufficiently justify your claims, it should also provide an accurate look at what you found in your study. Be sure to mention all relevant information.
Don't omit findings simply because they failed to support your predictions.
Your hypothesis may have expected more statistically significant results or your study didn't support your hypothesis , but that doesn't mean that the conclusions you reach are not useful. Provide data about what you found in your results section, then save your interpretation for what the results might mean in the discussion section.
While your study might not have supported your original predictions, your finding can provide important inspiration for future explorations into a topic.
How is the results section different from the discussion section?
The results section provides the results of your study or experiment . The goal of the section is to report what happened and the statistical analyses you performed. The discussion section is where you will examine what these results mean and whether they support or fail to support your hypothesis.
Report Your Statistical Findings
Always assume that your readers have a solid understanding of statistical concepts. There's no need to explain what a t-test is or how a one-way ANOVA works. Your responsibility is to report the results of your study, not to teach your readers how to analyze or interpret statistics.
Include Effect Sizes
The Publication Manual of the American Psychological Association recommends including effect sizes in your results section so that readers can appreciate the importance of your study's findings.
Your results section should include both text and illustrations. Presenting data in this way makes it easier for readers to quickly look at your results.
Structure your results section around tables or figures that summarize the results of your statistical analysis. In many cases, the easiest way to accomplish this is to first create your tables and figures and then organize them in a logical way. Next, write the summary text to support your illustrative materials.
Only include tables and figures if you are going to talk about them in the body text of your results section.
In addition to knowing what you should include in the results section of your psychology paper, it's also important to be aware of things that you should avoid putting in this section:
Cause-and-Effect Conclusions
Don't draw cause-effect conclusions. Avoid making any claims suggesting that your result "proves" that something is true.
Interpretations
Present the data without editorializing it. Save your comments and interpretations for the discussion section of your paper.
Statistics Without Context
Don't include statistics without narration. The results section should not be a numbers dump. Instead, you should sequentially narrate what these numbers mean.
Don't include the raw data in the results section. The results section should be a concise presentation of the results. If there is raw data that would be useful, include it in the appendix .
Don't only rely on descriptive text. Use tables and figures to present these findings when appropriate. This makes the results section easier to read and can convey a great deal of information quickly.
Repeated Data
Don't present the same data twice in your illustrative materials. If you have already presented some data in a table, don't present it again in a figure. If you have presented data in a figure, don't present it again in a table.
All of Your Findings
Don't feel like you have to include everything. If data is irrelevant to the research question, don't include it in the results section.
But Don't Skip Relevant Data
Don't leave out results because they don't support your claims. Even if your data does not support your hypothesis, including it in your findings is essential if it's relevant.
More Tips for Writing a Results Section
If you are struggling, there are a few things to remember that might help:
- Use the past tense . The results section should be written in the past tense.
- Be concise and objective . You will have the opportunity to give your own interpretations of the results in the discussion section.
- Use APA format . As you are writing your results section, keep a style guide on hand. The Publication Manual of the American Psychological Association is the official source for APA style .
- Visit your library . Read some journal articles that are on your topic. Pay attention to how the authors present the results of their research.
- Get a second opinion . If possible, take your paper to your school's writing lab for additional assistance.
What This Means For You
Remember, the results section of your paper is all about providing the data from your study. This section is often the shortest part of your paper, and in most cases, the most clinical.
Be sure not to include any subjective interpretation of the results. Simply relay the data in the most objective and straightforward way possible. You can then provide your own analysis of what these results mean in the discussion section of your paper.
Bavdekar SB, Chandak S. Results: Unraveling the findings . J Assoc Physicians India . 2015 Sep;63(9):44-6. PMID:27608866.
Snyder N, Foltz C, Lendner M, Vaccaro AR. How to write an effective results section . Clin Spine Surg . 2019;32(7):295-296. doi:10.1097/BSD.0000000000000845
American Psychological Association. Publication Manual of the American Psychological Association (7th ed.). Washington DC: The American Psychological Association; 2019.
Purdue Online Writing Lab. APA sample paper: Experimental psychology .
Berkeley University. Reviewing test results .
Tuncel A, Atan A. How to clearly articulate results and construct tables and figures in a scientific paper ? Turk J Urol . 2013;39(Suppl 1):16-19. doi:10.5152/tud.2013.048
By Kendra Cherry, MSEd Kendra Cherry, MS, is a psychosocial rehabilitation specialist, psychology educator, and author of the "Everything Psychology Book."

An official website of the United States government
The .gov means it’s official. Federal government websites often end in .gov or .mil. Before sharing sensitive information, make sure you’re on a federal government site.
The site is secure. The https:// ensures that you are connecting to the official website and that any information you provide is encrypted and transmitted securely.
- Publications
- Account settings
Preview improvements coming to the PMC website in October 2024. Learn More or Try it out now .
- Advanced Search
- Journal List
- Turk J Urol
- v.39(Suppl 1); 2013 Sep
How to clearly articulate results and construct tables and figures in a scientific paper?
The writing of the results section of a scientific paper is very important for the readers for clearly understanding of the study. This review summarizes the rules for writing the results section of a scientific paper and describes the use of tables and figures.
Introduction
Medical articles consist of review articles, case reports, and letters to the editor which are prepared with the intention of publishing in journals related to the medical discipline of the author. For an academician to be able to progress in carreer, and make his/her activities known in the academic environment, require preparation of the protocol of his/her academic research article, and acquiring sufficient information, and experience related to the composition of this article. In this review article, the information related to the writing of the ‘Results’ section, and use of tables, and figures will be presented to the attention of the readers.
Writing the ‘Results’ section
The ‘Results’ section is perhaps the most important part of a research article. In fact the authors will share the results of their research/study with their readers. Renown British biologist Thomas Henry Huxley (1825–1895) indicated his feelings as “The great tragedy of science: the slaying of a beautiful hypothesis by an ugly fact.” which emphasizes the importance of accurately, and impressively written results.
In essence results provide a response for the question” What is found in the research performed?”. Therefore, it is the most vital part of the article. As a priority, while drafting the ‘Results’ section of a manuscript one should not firstly write down methods in the ‘Material and Method’ section. The first sentence should give information about the number of patients who met the inclusion criteria, and thus enrolled in the study. [ 1 ] Besides information about the number of patients excluded from the study, and the reasons for exclusion is very important in that they will enlighten the readers, and reviewers who critically evaluate the manuscript, and also reflect the seriousness of the study. On the other hand, the results obtained should be recorded in chronological order, and without any comments. [ 2 ] In this section use of simple present tense is more appropriate. The findings should be expressed in brief, lucid, and explicable words. The writing style should not be boring for the reader. During writing process of a research article, a generally ill-conceived point is that positive, and significant findings are more important, attractive, and valuable, while negative, and insignificant findings are worthless, and less attractive. A scientific research is not performed to confirm a hypothesis, rather to test it. Not only positive, and significant results are worth writing, on the other hand negative or statistically insignificant result which support fallacy of a widely accepted opinion might be valuable. Therefore, all findings obtained during research should be inclıuded in the ‘Results’ section. [ 1 ]
While writing the ‘Results’ section, the sequence of results, tabulated data, and information which will be illustrated as figures should be definitively indicated. In indicating insignificant changes, do not use expressions as “decreased” or “increased”, these words should be reserved for significant changes. If results related to more than one parameter would be reported, it is appropriate to write the results under the subheading of its related parameter so as to facilitate reading, and comprehension of information. [ 2 ] Only data, and information concerning the study in question should be included in the ‘Results’ section. Results not mentioned in this section should not be included in the ‘Discussion’ and ‘Summary’ sections. Since the results obtained by the authors are cited in the ‘Results’ section, any reference should not be indicated in this section. [ 3 ]
In the ‘Results’ section, numerical expressions should be written in technically appropriate terms. The number of digits (1, 2 or 3 digits) to be written after a comma (in Turkish) or a point (in especially American English) should be determined The number of digits written after the punctuation marks should not be changed all throughout the text. Data should be expressed as mean/median ± standard deviation. Data as age, and scale scores should be indicated together with ranges of values. Absolute numerical value corresponding to a percentage must be also indicated. P values calculated in statistical analysis should be expressed in their absolute values. While writing p values of statistically significant data, instead of p<0.05 the actual level of significance should be recorded. If p value is smaller than 0.001, then it can be written as p <0.01. [ 2 ] While writing the ‘Results’ section, significant data which should be recalled by the readers must be indicated in the main text. It will be appropriate to indicate other demographic numerical details in tables or figures.
As an example elucidating the abovementioned topics a research paper written by the authors of this review article, and published in the Turkish Journal of Urology in the year 2007 (Türk Üroloji Dergisi 2007;33:18–23) is presented below:
“A total of 9 (56.2%) female, and 7 (43.8%) male patients with were included in this study. Mean age of all the patients was 44.3±13.8 (17–65) years, and mean dimensions of the adrenal mass was 4.5±3.4 (1–14) cm. Mean ages of the male, and female patients were 44.1 (30–65), and 42.4 (17–64) years, while mean diameters of adrenal masses were 3.2 (1–5), and 4.5 (1–14) cm (p age =0.963, p mass size =0.206). Surgical procedures were realized using transperitoneal approach through Chevron incision in 1 (6.2%), and retroperitoneal approach using flank incision with removal of the 11. rib in 15 (93.7%) patients. Right (n=6; 37.5%), and left (n=2; 12.5%) adrenalectomies were performed. Two (12.5%) patients underwent bilateral adrenalectomy in the same session because of clinical Cushing’s syndrome persisted despite transsphenoidal hipophysectomy. Mean operative time, and length of the hospital stay were 135 (65–190) min, and 3 (2–6) days, respectively. While resecting 11. rib during retroperitoneal adrenalectomy performed in 1 patient, pleura was perforated for nearly 1.5 cm. The perforated region was drained, and closed intraoperatively with 4/0 polyglyctan sutures. The patient did not develop postoperative pneumothorax. In none of the patients postoperative complications as pneumothorax, bleeding, prolonged drainage were seen. Results of histopathological analysis of the specimens retrieved at the end of the operation were summarized in Table 1 .” Table 1. Histopathological examination results of the patients Histopathological diagnosis Men n (%) Women n (%) Total n (%) Adrenal cortical adenoma 5 (31.3) 6 (37.6) 11 (68.8) Pheochromocytoma 1 (6.2) 1 (6.2) 2 (12.6) Ganglioneuroma 1 (6.2) - 1 (6.2) Myelolipoma - 1 (6.2) 1 (6.2) Adrenal carcinoma - 1 (6.2) 1 (6.2) Total 7 (43.7) 9 (56.2) 16 (100) Open in a separate window
Use of tables, and figures
To prevent the audience from getting bored while reading a scientific article, some of the data should be expressed in a visual format in graphics, and figures rather than crowded numerical values in the text. Peer-reviewers frequently look at tables, and figures. High quality tables, and figures increase the chance of acceptance of the manuscript for publication.
Number of tables in the manuscript should not exceed the number recommended by the editorial board of the journal. Data in the main text, and tables should not be repeated many times. Tables should be comprehensible, and a reader should be able to express an opinion about the results just at looking at the tables without reading the main text. Data included in tables should comply with those mentioned in the main text, and percentages in rows, and columns should be summed up accurately. Unit of each variable should be absolutely defined. Sampling size of each group should be absolutely indicated. Values should be expressed as values±standard error, range or 95% confidence interval. Tables should include precise p values, and level of significance as assessed with statistical analysis should be indicated in footnotes. [ 2 ] Use of abbreviations in tables should be avoided, if abbreviations are required they should be defined explicitly in the footnotes or legends of the tables. As a general rule, rows should be arranged as double-spaced Besides do not use pattern coloring for cells of rows, and columns. Values included in tables should be correctly approximated. [ 1 , 2 ]
As an example elucidating the abovementioned topics a research paper written by the authors of this review article, and published in the Turkish Journal of Urology in the year 2007 (Türk Üroloji Dergisi 2007;33:18–23).is shown in Table 1 .
Most of the readers priorly prefer to look at figures, and graphs rather than reading lots of pages. Selection of appropriate types of graphs for demonstration of data is a critical decision which requires artist’s meticulousness. As is the case with tables, graphs, and figures should also disploay information not provided in the text. Bar, line, and pie graphs, scatter plots, and histograms are some examples of graphs. In graphs, independent variables should be represented on the horizontal, and dependent variables on the vertical axis. Number of subjects in every subgroup should be indicated The labels on each axis should be easily understandable. [ 2 ] The label of the Y axis should be written vertically from bottom to top. The fundamental point in writing explanatory notes for graphs, and figures is to help the readers understand the contents of them without referring to the main text. Meanings of abbreviations, and acronyms used in the graphs, and figures should be provided in explanatory notes. In the explanatory notes striking data should be emphasized. Statistical tests used, levels of significance, sampling size, stains used for analyses, and magnification rate should be written in order to facilitate comprehension of the study procedures. [ 1 , 2 ]
Flow diagram can be utilized in the ‘Results’ section. This diagram facilitates comprehension of the results obtained at certain steps of monitorization during the research process. Flow diagram can be used either in the ‘Results’ or ‘Material and Method’ section. [ 2 , 3 ]
Histopathological analyses, surgical technique or radiological images which are considered to be more useful for the comprehension of the text by the readers can be visually displayed. Important findings should be marked on photos, and their definitions should be provided clearly in the explanatory legends. [ 1 ]
As an example elucidating the abovementioned issues, graphics, and flow diagram in the ‘Results’ section of a research paper written by the authors of this review article, and published in the World Journal of Urology in the year 2010 (World J Urol 2010;28:17–22.) are shown in Figures 1 , and and2 2 .

a The mean SHIM scores of the groups before and after treatment. SHIM sexual health inventory for male. b The mean IPSS scores of the groups before and after treatment. IPSS international prostate symptom score

Flowchart showing patients’ progress during the study. SHIM sexual health inventory for male, IIEF international index of erectile function, IPSS international prostate symptom score, QoL quality of life, Q max maximum urinary flow rate. PRV post voiding residual urine volume
In conclusion, in line with the motto of the famous German physicist Albert Einstein (1879–1955). ‘If you are out to describe the truth, leave elegance to the tailor .’ results obtained in a scientific research article should be expressed accurately, and with a masterstroke of a tailor in compliance with certain rules which will ensure acceptability of the scientific manuscript by the editorial board of the journal, and also facilitate its intelligibility by the readers.
An official website of the United States government
The .gov means it’s official. Federal government websites often end in .gov or .mil. Before sharing sensitive information, make sure you’re on a federal government site.
The site is secure. The https:// ensures that you are connecting to the official website and that any information you provide is encrypted and transmitted securely.
- Publications
- Account settings
- My Bibliography
- Collections
- Citation manager
Save citation to file
Email citation, add to collections.
- Create a new collection
- Add to an existing collection
Add to My Bibliography
Your saved search, create a file for external citation management software, your rss feed.
- Search in PubMed
- Search in NLM Catalog
- Add to Search
How to Write an Effective Results Section
Affiliation.
- 1 Rothman Orthopaedics Institute, Philadelphia, PA.
- PMID: 31145152
- DOI: 10.1097/BSD.0000000000000845
Developing a well-written research paper is an important step in completing a scientific study. This paper is where the principle investigator and co-authors report the purpose, methods, findings, and conclusions of the study. A key element of writing a research paper is to clearly and objectively report the study's findings in the Results section. The Results section is where the authors inform the readers about the findings from the statistical analysis of the data collected to operationalize the study hypothesis, optimally adding novel information to the collective knowledge on the subject matter. By utilizing clear, concise, and well-organized writing techniques and visual aids in the reporting of the data, the author is able to construct a case for the research question at hand even without interpreting the data.
PubMed Disclaimer
Similar articles
- How to Write Effective Discussion and Conclusion Sections. Makar G, Foltz C, Lendner M, Vaccaro AR. Makar G, et al. Clin Spine Surg. 2018 Oct;31(8):345-346. doi: 10.1097/BSD.0000000000000687. Clin Spine Surg. 2018. PMID: 29979216
- How to write an original radiological research manuscript. Bannas P, Reeder SB. Bannas P, et al. Eur Radiol. 2017 Nov;27(11):4455-4460. doi: 10.1007/s00330-017-4879-8. Epub 2017 Jun 14. Eur Radiol. 2017. PMID: 28616726 Free PMC article. Review.
- Rules to be adopted for publishing a scientific paper. Picardi N. Picardi N. Ann Ital Chir. 2016;87:1-3. Ann Ital Chir. 2016. PMID: 28474609
- The rites of writing papers: steps to successful publishing for psychiatrists. Brakoulias V, Macfarlane MD, Looi JC. Brakoulias V, et al. Australas Psychiatry. 2015 Feb;23(1):32-6. doi: 10.1177/1039856214560180. Epub 2014 Dec 2. Australas Psychiatry. 2015. PMID: 25469001
- How to write a research paper. Alexandrov AV. Alexandrov AV. Cerebrovasc Dis. 2004;18(2):135-8. doi: 10.1159/000079266. Epub 2004 Jun 23. Cerebrovasc Dis. 2004. PMID: 15218279 Review.
- Essential Guide to Manuscript Writing for Academic Dummies: An Editor's Perspective. Aga SS, Nissar S. Aga SS, et al. Biochem Res Int. 2022 Sep 1;2022:1492058. doi: 10.1155/2022/1492058. eCollection 2022. Biochem Res Int. 2022. PMID: 36092536 Free PMC article. Review.
- Search in MeSH
LinkOut - more resources
Full text sources.
- Ovid Technologies, Inc.
- Wolters Kluwer

- Citation Manager
NCBI Literature Resources
MeSH PMC Bookshelf Disclaimer
The PubMed wordmark and PubMed logo are registered trademarks of the U.S. Department of Health and Human Services (HHS). Unauthorized use of these marks is strictly prohibited.
Organizing Academic Research Papers: 7. The Results
- Purpose of Guide
- Design Flaws to Avoid
- Glossary of Research Terms
- Narrowing a Topic Idea
- Broadening a Topic Idea
- Extending the Timeliness of a Topic Idea
- Academic Writing Style
- Choosing a Title
- Making an Outline
- Paragraph Development
- Executive Summary
- Background Information
- The Research Problem/Question
- Theoretical Framework
- Citation Tracking
- Content Alert Services
- Evaluating Sources
- Primary Sources
- Secondary Sources
- Tertiary Sources
- What Is Scholarly vs. Popular?
- Qualitative Methods
- Quantitative Methods
- Using Non-Textual Elements
- Limitations of the Study
- Common Grammar Mistakes
- Avoiding Plagiarism
- Footnotes or Endnotes?
- Further Readings
- Annotated Bibliography
- Dealing with Nervousness
- Using Visual Aids
- Grading Someone Else's Paper
- How to Manage Group Projects
- Multiple Book Review Essay
- Reviewing Collected Essays
- About Informed Consent
- Writing Field Notes
- Writing a Policy Memo
- Writing a Research Proposal
- Acknowledgements
The results section of the research paper is where you report the findings of your study based upon the information gathered as a result of the methodology [or methodologies] you applied. The results section should simply state the findings, without bias or interpretation, and arranged in a logical sequence. The results section should always be written in the past tense. A section describing results [a.k.a., "findings"] is particularly necessary if your paper includes data generated from your own research.
Importance of a Good Results Section
When formulating the results section, it's important to remember that the results of a study do not prove anything . Research results can only confirm or reject the research problem underpinning your study. However, the act of articulating the results helps you to understand the problem from within, to break it into pieces, and to view the research problem from various perspectives.
The page length of this section is set by the amount and types of data to be reported . Be concise, using non-textual elements, such as figures and tables, if appropriate, to present results more effectively. In deciding what data to describe in your results section, you must clearly distinguish material that would normally be included in a research paper from any raw data or other material that could be included as an appendix. In general, raw data should not be included in the main text of your paper unless requested to do so by your professor.
Avoid providing data that is not critical to answering the research question . The background information you described in the introduction section should provide the reader with any additional context or explanation needed to understand the results. A good rule is to always re-read the background section of your paper after you have written up your results to ensure that the reader has enough context to understand the results [and, later, how you interpreted the results in the discussion section of your paper].
Bates College; Burton, Neil et al. Doing Your Education Research Project . Los Angeles, CA: SAGE, 2008; Results . The Structure, Format, Content, and Style of a Journal-Style Scientific Paper. Department of Biology. Bates College.
Structure and Writing Style
I. Structure and Approach
For most research paper formats, there are two ways of presenting and organizing the results .
- Present the results followed by a short explanation of the findings . For example, you may have noticed an unusual correlation between two variables during the analysis of your findings. It is correct to point this out in the results section. However, speculating as to why this correlation exists, and offering a hypothesis about what may be happening, belongs in the discussion section of your paper.
- Present a section and then discuss it, before presenting the next section then discussing it, and so on . This is more common in longer papers because it helps the reader to better understand each finding. In this model, it can be helpful to provide a brief conclusion in the results section that ties each of the findings together and links to the discussion.
NOTE: The discussion section should generally follow the same format chosen in presenting and organizing the results.
II. Content
In general, the content of your results section should include the following elements:
- An introductory context for understanding the results by restating the research problem that underpins the purpose of your study.
- A summary of your key findings arranged in a logical sequence that generally follows your methodology section.
- Inclusion of non-textual elements, such as, figures, charts, photos, maps, tables, etc. to further illustrate the findings, if appropriate.
- In the text, a systematic description of your results, highlighting for the reader observations that are most relevant to the topic under investigation [remember that not all results that emerge from the methodology that you used to gather the data may be relevant].
- Use of the past tense when refering to your results.
- The page length of your results section is guided by the amount and types of data to be reported. However, focus only on findings that are important and related to addressing the research problem.
Using Non-textual Elements
- Either place figures, tables, charts, etc. within the text of the result, or include them in the back of the report--do one or the other but never do both.
- In the text, refer to each non-textual element in numbered order [e.g., Table 1, Table 2; Chart 1, Chart 2; Map 1, Map 2].
- If you place non-textual elements at the end of the report, make sure they are clearly distinguished from any attached appendix materials, such as raw data.
- Regardless of placement, each non-textual element must be numbered consecutively and complete with caption [caption goes under the figure, table, chart, etc.]
- Each non-textual element must be titled, numbered consecutively, and complete with a heading [title with description goes above the figure, table, chart, etc.].
- In proofreading your results section, be sure that each non-textual element is sufficiently complete so that it could stand on its own, separate from the text.
III. Problems to Avoid
When writing the results section, avoid doing the following :
- Discussing or interpreting your results . Save all this for the next section of your paper, although where appropriate, you should compare or contrast specific results to those found in other studies [e.g., "Similar to Smith [1990], one of the findings of this study is the strong correlation between motivation and academic achievement...."].
- Reporting background information or attempting to explain your findings ; this should have been done in your Introduction section, but don't panic! Often the results of a study point to the need to provide additional background information or to explain the topic further, so don't think you did something wrong. Revise your introduction as needed.
- Ignoring negative results . If some of your results fail to support your hypothesis, do not ignore them. Document them, then state in your discussion section why you believe a negative result emerged from your study. Note that negative results, and how you handle them, often provides you with the opportunity to write a more engaging discussion section, therefore, don't be afraid to highlight them.
- Including raw data or intermediate calculations . Ask your professor if you need to include any raw data generated by your study, such as transcripts from interviews or data files. If raw data is to be included, place it in an appendix or set of appendices that are referred to in the text.
- Be as factual and concise as possible in reporting your findings . Do not use phrases that are vague or non-specific, such as, "appeared to be greater or lesser than..." or "demonstrates promising trends that...."
- Presenting the same data or repeating the same information more than once . If you feel the need to highlight something, you will have a chance to do that in the discussion section.
- Confusing figures with tables . Be sure to properly label any non-textual elements in your paper. If you are not sure, look up the term in a dictionary.
Burton, Neil et al. Doing Your Education Research Project . Los Angeles, CA: SAGE, 2008; Caprette, David R. Writing Research Papers . Experimental Biosciences Resources. Rice University; Hancock, Dawson R. and Bob Algozzine. Doing Case Study Research: A Practical Guide for Beginning Researchers . 2nd ed. New York: Teachers College Press, 2011; Introduction to Nursing Research: Reporting Research Findings. Nursing Research: Open Access Nursing Research and Review Articles. (January 4, 2012); Reporting Research Findings. Wilder Research, in partnership with the Minnesota Department of Human Services. (February 2009); Results . The Structure, Format, Content, and Style of a Journal-Style Scientific Paper. Department of Biology. Bates College; Schafer, Mickey S. Writing the Results . Thesis Writing in the Sciences. Course Syllabus. University of Florida.
Writing Tip
Why Don't I Just Combine the Results Section with the Discussion Section?
It's not unusual to find articles in social science journals where the author(s) have combined a description of the findings from the study with a discussion about their implications. You could do this. However, if you are inexperienced writing research papers, consider creating two sections for each element in your paper as a way to better organize your thoughts and, by extension, your paper. Think of the results section as the place where you report what your study found; think of the discussion section as the place where you interpret your data and answer the "so what?" question. As you become more skilled writing research papers, you may want to meld the results of your study with a discussion of its implications.
- << Previous: Quantitative Methods
- Next: Using Non-Textual Elements >>
- Last Updated: Jul 18, 2023 11:58 AM
- URL: https://library.sacredheart.edu/c.php?g=29803
- QuickSearch
- Library Catalog
- Databases A-Z
- Publication Finder
- Course Reserves
- Citation Linker
- Digital Commons
- Our Website
Research Support
- Ask a Librarian
- Appointments
- Interlibrary Loan (ILL)
- Research Guides
- Databases by Subject
- Citation Help
Using the Library
- Reserve a Group Study Room
- Renew Books
- Honors Study Rooms
- Off-Campus Access
- Library Policies
- Library Technology
User Information
- Grad Students
- Online Students
- COVID-19 Updates
- Staff Directory
- News & Announcements
- Library Newsletter
My Accounts
- Interlibrary Loan
- Staff Site Login
FIND US ON
How to Present Results in a Research Paper
- First Online: 01 October 2023
Cite this chapter

- Aparna Mukherjee 4 ,
- Gunjan Kumar 4 &
- Rakesh Lodha 5
931 Accesses
The results section is the core of a research manuscript where the study data and analyses are presented in an organized, uncluttered manner such that the reader can easily understand and interpret the findings. This section is completely factual; there is no place for opinions or explanations from the authors. The results should correspond to the objectives of the study in an orderly manner. Self-explanatory tables and figures add value to this section and make data presentation more convenient and appealing. The results presented in this section should have a link with both the preceding methods section and the following discussion section. A well-written, articulate results section lends clarity and credibility to the research paper and the study as a whole. This chapter provides an overview and important pointers to effective drafting of the results section in a research manuscript and also in theses.
This is a preview of subscription content, log in via an institution to check access.
Access this chapter
Subscribe and save.
- Get 10 units per month
- Download Article/Chapter or Ebook
- 1 Unit = 1 Article or 1 Chapter
- Cancel anytime
- Available as PDF
- Read on any device
- Instant download
- Own it forever
- Available as EPUB and PDF
- Durable hardcover edition
- Dispatched in 3 to 5 business days
- Free shipping worldwide - see info
Tax calculation will be finalised at checkout
Purchases are for personal use only
Institutional subscriptions
Conclusions

Research Method

Research Questions and Research Design
Kallestinova ED (2011) How to write your first research paper. Yale J Biol Med 84(3):181–190
PubMed PubMed Central Google Scholar
STROBE. STROBE. [cited 2022 Nov 10]. https://www.strobe-statement.org/
Consort—Welcome to the CONSORT Website. http://www.consort-statement.org/ . Accessed 10 Nov 2022
Korevaar DA, Cohen JF, Reitsma JB, Bruns DE, Gatsonis CA, Glasziou PP et al (2016) Updating standards for reporting diagnostic accuracy: the development of STARD 2015. Res Integr Peer Rev 1(1):7
Article PubMed PubMed Central Google Scholar
Page MJ, McKenzie JE, Bossuyt PM, Boutron I, Hoffmann TC, Mulrow CD et al (2021) The PRISMA 2020 statement: an updated guideline for reporting systematic reviews. BMJ 372:n71
Page MJ, Moher D, Bossuyt PM, Boutron I, Hoffmann TC, Mulrow CD et al (2021) PRISMA 2020 explanation and elaboration: updated guidance and exemplars for reporting systematic reviews. BMJ 372:n160
Consolidated criteria for reporting qualitative research (COREQ): a 32-item checklist for interviews and focus groups | EQUATOR Network. https://www.equator-network.org/reporting-guidelines/coreq/ . Accessed 10 Nov 2022
Aggarwal R, Sahni P (2015) The results section. In: Aggarwal R, Sahni P (eds) Reporting and publishing research in the biomedical sciences, 1st edn. National Medical Journal of India, Delhi, pp 24–44
Google Scholar
Mukherjee A, Lodha R (2016) Writing the results. Indian Pediatr 53(5):409–415
Article PubMed Google Scholar
Lodha R, Randev S, Kabra SK (2016) Oral antibiotics for community acquired pneumonia with chest indrawing in children aged below five years: a systematic review. Indian Pediatr 53(6):489–495
Anderson C (2010) Presenting and evaluating qualitative research. Am J Pharm Educ 74(8):141
Roberts C, Kumar K, Finn G (2020) Navigating the qualitative manuscript writing process: some tips for authors and reviewers. BMC Med Educ 20:439
Bigby C (2015) Preparing manuscripts that report qualitative research: avoiding common pitfalls and illegitimate questions. Aust Soc Work 68(3):384–391
Article Google Scholar
Vincent BP, Kumar G, Parameswaran S, Kar SS (2019) Barriers and suggestions towards deceased organ donation in a government tertiary care teaching hospital: qualitative study using socio-ecological model framework. Indian J Transplant 13(3):194
McCormick JB, Hopkins MA (2021) Exploring public concerns for sharing and governance of personal health information: a focus group study. JAMIA Open 4(4):ooab098
Groenland -emeritus professor E. Employing the matrix method as a tool for the analysis of qualitative research data in the business domain. Rochester, NY; 2014. https://papers.ssrn.com/abstract=2495330 . Accessed 10 Nov 2022
Download references
Acknowledgments
The book chapter is derived in part from our article “Mukherjee A, Lodha R. Writing the Results. Indian Pediatr. 2016 May 8;53(5):409-15.” We thank the Editor-in-Chief of the journal “Indian Pediatrics” for the permission for the same.
Author information
Authors and affiliations.
Clinical Studies, Trials and Projection Unit, Indian Council of Medical Research, New Delhi, India
Aparna Mukherjee & Gunjan Kumar
Department of Pediatrics, All India Institute of Medical Sciences, New Delhi, India
Rakesh Lodha
You can also search for this author in PubMed Google Scholar
Corresponding author
Correspondence to Rakesh Lodha .
Editor information
Editors and affiliations.
Retired Senior Expert Pharmacologist at the Office of Cardiology, Hematology, Endocrinology, and Nephrology, Center for Drug Evaluation and Research, US Food and Drug Administration, Silver Spring, MD, USA
Gowraganahalli Jagadeesh
Professor & Director, Research Training and Publications, The Office of Research and Development, Periyar Maniammai Institute of Science & Technology (Deemed to be University), Vallam, Tamil Nadu, India
Pitchai Balakumar
Division Cardiology & Nephrology, Office of Cardiology, Hematology, Endocrinology and Nephrology, Center for Drug Evaluation and Research, US Food and Drug Administration, Silver Spring, MD, USA
Fortunato Senatore
Ethics declarations
Rights and permissions.
Reprints and permissions
Copyright information
© 2023 The Author(s), under exclusive license to Springer Nature Singapore Pte Ltd.
About this chapter
Mukherjee, A., Kumar, G., Lodha, R. (2023). How to Present Results in a Research Paper. In: Jagadeesh, G., Balakumar, P., Senatore, F. (eds) The Quintessence of Basic and Clinical Research and Scientific Publishing. Springer, Singapore. https://doi.org/10.1007/978-981-99-1284-1_44
Download citation
DOI : https://doi.org/10.1007/978-981-99-1284-1_44
Published : 01 October 2023
Publisher Name : Springer, Singapore
Print ISBN : 978-981-99-1283-4
Online ISBN : 978-981-99-1284-1
eBook Packages : Biomedical and Life Sciences Biomedical and Life Sciences (R0)
Share this chapter
Anyone you share the following link with will be able to read this content:
Sorry, a shareable link is not currently available for this article.
Provided by the Springer Nature SharedIt content-sharing initiative
- Publish with us
Policies and ethics
- Find a journal
- Track your research

The Plagiarism Checker Online For Your Academic Work
Start Plagiarism Check
Editing & Proofreading for Your Research Paper
Get it proofread now
Online Printing & Binding with Free Express Delivery
Configure binding now
- Academic essay overview
- The writing process
- Structuring academic essays
- Types of academic essays
- Academic writing overview
- Sentence structure
- Academic writing process
- Improving your academic writing
- Titles and headings
- APA style overview
- APA citation & referencing
- APA structure & sections
- Citation & referencing
- Structure and sections
- APA examples overview
- Commonly used citations
- Other examples
- British English vs. American English
- Chicago style overview
- Chicago citation & referencing
- Chicago structure & sections
- Chicago style examples
- Citing sources overview
- Citation format
- Citation examples
- College essay overview
- Application
- How to write a college essay
- Types of college essays
- Commonly confused words
- Definitions
- Dissertation overview
- Dissertation structure & sections
- Dissertation writing process
- Graduate school overview
- Application & admission
- Study abroad
- Master degree
- Harvard referencing overview
- Language rules overview
- Grammatical rules & structures
- Parts of speech
- Punctuation
- Methodology overview
- Analyzing data
- Experiments
- Observations
- Inductive vs. Deductive
- Qualitative vs. Quantitative
- Types of validity
- Types of reliability
- Sampling methods
- Theories & Concepts
- Types of research studies
- Types of variables
- MLA style overview
- MLA examples
- MLA citation & referencing
- MLA structure & sections
- Plagiarism overview
- Plagiarism checker
- Types of plagiarism
- Printing production overview
- Research bias overview
- Types of research bias
- Example sections
- Types of research papers
- Research process overview
- Problem statement
- Research proposal
- Research topic
- Statistics overview
- Levels of measurment
- Frequency distribution
- Measures of central tendency
- Measures of variability
- Hypothesis testing
- Parameters & test statistics
- Types of distributions
- Correlation
- Effect size
- Hypothesis testing assumptions
- Types of ANOVAs
- Types of chi-square
- Statistical data
- Statistical models
- Spelling mistakes
- Tips overview
- Academic writing tips
- Dissertation tips
- Sources tips
- Working with sources overview
- Evaluating sources
- Finding sources
- Including sources
- Types of sources

Your Step to Success
Plagiarism Check within 10min
Printing & Binding with 3D Live Preview
APA Results Section – Explanation & Examples
How do you like this article cancel reply.
Save my name, email, and website in this browser for the next time I comment.

The APA results section summarizes data and includes reporting statistics in a quantitative research study. The APA results section is an essential part of your research paper and typically begins with a brief overview of the data followed by a systematic and detailed reporting of each hypothesis tested. The interpreted results will then be presented in the discussion sections. Ensure you adhere to APA style guidelines consistently throughout the paper.
Inhaltsverzeichnis
- 1 APA Results Section – In a Nutshell
- 2 Definition: APA results section
- 3 What’s included in the APA results section?
- 4 APA results section: Introducing the data
- 5 APA results section: Summarizing the data
- 6 APA results section: Reporting the results
- 7 APA results section: Formatting numbers
- 8 APA results section: Don’t include these
APA Results Section – In a Nutshell
- The APA results section of empirical manuscripts reports the quantitative results of a study conducted on a data set.
- The APA results section provides concrete evidence to disprove or confirm the hypothesis.
Definition: APA results section
The American Psychological Association recommends the APA style guide for presenting results in a manuscript. A research manuscript’s APA results section describes the researcher’s findings following a thorough data analysis and interpretation of the results. It uses obtained data to test or refute the theory of a research study.
What’s included in the APA results section?
The APA results section includes preliminary details on the data, participants, statistics , and the results of the explanatory analysis , as discussed below.
- Participants – The number of participants is reported at every study stage
- Missing data – Identifying the amount of data excluded from the final analysis.
- Adverse effects – Report any unforeseen events for clinical studies
- Descriptive statistics – Summarize the secondary and primary outcomes of a study
- Inferential statistics – Helps researchers draw conclusions and make predictions from the data.
- Confidence interval and effect size – Confidence intervals are a range of possible values for the data set mean.
- Results of explanatory analysis – An exploratory research investigates data to test a hypothesis, check assumptions, and find anomalies.
APA results section: Introducing the data
Before you discuss your research findings, start by clearly describing the participants at each study stage. If any data was excluded from the eventual analysis, indicate that too.
Participants
Recruitment, participant flow, and attrition should be reported. Attrition bias affects external and internal validity and produces erroneous results.
A flow chart is often the best way to report the number of participants per group per stage and their reasons for attrition. Below is an example of how to report participant flow.
- 25% of the 400 participants who signed up and completed the first survey were eliminated for not fitting the research criteria.
- 15% didn’t use fiber optics internet exclusively.
- 10% did not have internet access.
- 300 participants progressed to the final survey round for a gift bag.
- 52 people didn’t complete the survey.
This resulted in 248 research participants.
Missing data & adverse effects
In any study, missing data must be reported. Unexpected events, poor storage, and equipment failures can cause missing data. In any instance, clearly explain why you couldn’t use the data.
Data outliers can be excluded from the final study, but you must explain why. Include how you handled missing data. Standard procedures include mean-value imputation, interpolation, extrapolation, and substitution.
- Results of 33 participants were excluded from the study as they did not meet the research criteria.
- The data for another 4 participants were lost due to human error.
APA results section: Summarizing the data
It is important to note that you should provide a summary of your study’s results. However, you can create a supplemental archive for other researchers to access raw data. 2
Descriptive Statistics
Descriptive statistics are concise coefficients that summarize a specific data collection , such as a population sample or APA results section. APA results section can include descriptive statistics such as:
- Central tendency measures describe a data set by identifying the center of the data set. ( mode , median, mean )
- Measures of variability describe the score dispersion within a data set. ( standard deviation , range, variance , and interquartile range )
- Sample sizes
- Variables of interest, which are measured, changing quantities in experimental studies. Be sure to explain how you operationalized any variable of interest you use.
- 20 athletes in five trials were given 400 mg of a performance-enhancing substance to measure their speed (m/s ) and reaction time(s).
- After averaging each athlete’s speed and response time, the group’s averages were calculated.
The group that used the performance-enhancing drug had a higher speed (m/s) than the group that did not use the drug ( M = 4, SD=1.25 )
APA results section: Reporting the results
APA journal standards require all the appropriate hypothesis tests, confidence intervals, and effect size estimates to be reported in the APA results section.
Inferential statistics
Inferential statistics help researchers draw conclusions and make predictions based on the data.
When you are reporting the inferential statistics in the APA results section, use the following:
- Degrees of freedom
- Test statistic (includes the z-score, t-value, and f-ratio )
- Error term (if needed, though it is not included in correlations and non-parametric tests.)
- The exact p-value (unless . 001)
In keeping with the hypotheses, athletes who take performance-enhancing drugs have increased reaction times, and speeds, t (20) = 1s , p .001
Confidence intervals & effect sizes
A confidence interval can be described as a range of possible values for the mean derived from the sample data. It helps show the variability that is around point estimates. You should include confidence intervals any time you report estimates for population parameters.
Night guards consume an average of 600 mg of caffeine weekly, 93% CI [90, 200}
Effect size measures an experiment’s magnitude. It explains the research’s significance. Since effect size is an estimate, confidence intervals should be included.
Moderate amounts of performance-enhancing drugs increase speed significantly, Cohen’s d =1.4, 93% CI [0.92, 1.57]
Subgroup & exploratory analyses
Exploratory analysis tests a hypothesis, checks assumptions , and finds patterns and anomalies in data . If you find notable results, report them as exploratory, not confirming, to avoid overstating their value.
APA results section: Formatting numbers
Use figures, text, and tables to show numbers in APA results sections properly.
✓ For three or fewer numbers, use a sentence, a table for 4 and 20 numbers, and a figure for more than 20 .
✓ Number and title the APA tables and figures , as well as relevant notes. If you have already presented the data in a table, do not repeat it in a figure and vice versa.
✓ Statistics in your APA results section must be abbreviated, capitalized, and italicized.
✓ Use APA norms for reporting statistics and writing numbers.
✓ Look up these guidelines if you are unsure how to present certain symbols.
- ✓ Post a picture on Instagram
- ✓ Get the most likes on your picture
- ✓ Receive up to $300 cash back
APA results section: Don’t include these
Besides knowing what to include in an APA results section, it is just as important to know what not to have. Below is an outline of what you should exclude from an APA results section.
| The APA results section should have results that are presented concisely. | |
| Include it in the discussion section and only objectively report findings in the APA results section. | |
| Assume the readers have professional knowledge of statistical inferences. | |
| Only include data relevant to the research question in the APA results section. |
What should be included in the APA results section?
The APA results section should include details on the participants, descriptive statistics and inferential statistics , missing data , and the results of any exploratory analysis.
What tense should I use to write my results?
Write the APA results section in the past tense.
When should I include tables and figures?
Include tables and figures if you will discuss them in the body text of the APA results section.
Excellent product. Quick delivery. Easy to order and you can see the finished...
We use cookies on our website. Some of them are essential, while others help us to improve this website and your experience.
- External Media
Individual Privacy Preferences
Cookie Details Privacy Policy Imprint
Here you will find an overview of all cookies used. You can give your consent to whole categories or display further information and select certain cookies.
Accept all Save
Essential cookies enable basic functions and are necessary for the proper function of the website.
Show Cookie Information Hide Cookie Information
| Name | |
|---|---|
| Anbieter | Eigentümer dieser Website, |
| Zweck | Speichert die Einstellungen der Besucher, die in der Cookie Box von Borlabs Cookie ausgewählt wurden. |
| Cookie Name | borlabs-cookie |
| Cookie Laufzeit | 1 Jahr |
| Name | |
|---|---|
| Anbieter | Bachelorprint |
| Zweck | Erkennt das Herkunftsland und leitet zur entsprechenden Sprachversion um. |
| Datenschutzerklärung | |
| Host(s) | ip-api.com |
| Cookie Name | georedirect |
| Cookie Laufzeit | 1 Jahr |
| Name | |
|---|---|
| Anbieter | Playcanvas |
| Zweck | Display our 3D product animations |
| Datenschutzerklärung | |
| Host(s) | playcanv.as, playcanvas.as, playcanvas.com |
| Cookie Laufzeit | 1 Jahr |
Statistics cookies collect information anonymously. This information helps us to understand how our visitors use our website.
| Akzeptieren | |
|---|---|
| Name | |
| Anbieter | Google Ireland Limited, Gordon House, Barrow Street, Dublin 4, Ireland |
| Zweck | Cookie von Google zur Steuerung der erweiterten Script- und Ereignisbehandlung. |
| Datenschutzerklärung | |
| Cookie Name | _ga,_gat,_gid |
| Cookie Laufzeit | 2 Jahre |
Content from video platforms and social media platforms is blocked by default. If External Media cookies are accepted, access to those contents no longer requires manual consent.
| Akzeptieren | |
|---|---|
| Name | |
| Anbieter | Meta Platforms Ireland Limited, 4 Grand Canal Square, Dublin 2, Ireland |
| Zweck | Wird verwendet, um Facebook-Inhalte zu entsperren. |
| Datenschutzerklärung | |
| Host(s) | .facebook.com |
| Akzeptieren | |
|---|---|
| Name | |
| Anbieter | Google Ireland Limited, Gordon House, Barrow Street, Dublin 4, Ireland |
| Zweck | Wird zum Entsperren von Google Maps-Inhalten verwendet. |
| Datenschutzerklärung | |
| Host(s) | .google.com |
| Cookie Name | NID |
| Cookie Laufzeit | 6 Monate |
| Akzeptieren | |
|---|---|
| Name | |
| Anbieter | Meta Platforms Ireland Limited, 4 Grand Canal Square, Dublin 2, Ireland |
| Zweck | Wird verwendet, um Instagram-Inhalte zu entsperren. |
| Datenschutzerklärung | |
| Host(s) | .instagram.com |
| Cookie Name | pigeon_state |
| Cookie Laufzeit | Sitzung |
| Akzeptieren | |
|---|---|
| Name | |
| Anbieter | Openstreetmap Foundation, St John’s Innovation Centre, Cowley Road, Cambridge CB4 0WS, United Kingdom |
| Zweck | Wird verwendet, um OpenStreetMap-Inhalte zu entsperren. |
| Datenschutzerklärung | |
| Host(s) | .openstreetmap.org |
| Cookie Name | _osm_location, _osm_session, _osm_totp_token, _osm_welcome, _pk_id., _pk_ref., _pk_ses., qos_token |
| Cookie Laufzeit | 1-10 Jahre |
| Akzeptieren | |
|---|---|
| Name | |
| Anbieter | Twitter International Company, One Cumberland Place, Fenian Street, Dublin 2, D02 AX07, Ireland |
| Zweck | Wird verwendet, um Twitter-Inhalte zu entsperren. |
| Datenschutzerklärung | |
| Host(s) | .twimg.com, .twitter.com |
| Cookie Name | __widgetsettings, local_storage_support_test |
| Cookie Laufzeit | Unbegrenzt |
| Akzeptieren | |
|---|---|
| Name | |
| Anbieter | Vimeo Inc., 555 West 18th Street, New York, New York 10011, USA |
| Zweck | Wird verwendet, um Vimeo-Inhalte zu entsperren. |
| Datenschutzerklärung | |
| Host(s) | player.vimeo.com |
| Cookie Name | vuid |
| Cookie Laufzeit | 2 Jahre |
| Akzeptieren | |
|---|---|
| Name | |
| Anbieter | Google Ireland Limited, Gordon House, Barrow Street, Dublin 4, Ireland |
| Zweck | Wird verwendet, um YouTube-Inhalte zu entsperren. |
| Datenschutzerklärung | |
| Host(s) | google.com |
| Cookie Name | NID |
| Cookie Laufzeit | 6 Monate |
Privacy Policy Imprint

How to Write the Results Section of A Research Paper

How to Evaluate Research
Writing a research paper can be a daunting experience. Whether it is your first college paper, the very first lab report you have done in high school or something you are hoping to have published, it can feel like a lot to master. Clearly, when you are doing an experiment, you want to list the results of the experiment or the research.
How do you structure the results of an experiment, and how do you communicate the results of your research? By writing clearly and answering any questions you raised earlier in your paper, you can be sure that your results section will be easily comprehensible and will bring your paper to a strong conclusion.
What Is a Research Paper?
Defined broadly, a research paper is any sort of written account of work that you undertook in order to learn more about a specific topic or set of conditions. Whether you read books in a library about ancient Egyptian hieroglyphics or wanted to conduct an experiment to see whether the sun can melt pennies, the written account of this exploration can be termed a "research paper."
In some situations, a research paper is also called a "lab report." This is usually the case when the investigation in question pertains to an experiment that was conducted in lab-like conditions. Either way, it essentially functions as a research paper.
Most research papers begin as a school assignment. While people in the academic or scientific fields and individuals who are interested in pursuing topics independently may take on research papers as a work assignment, most people's first research paper takes place while in school. Whatever you are researching, begin to think about it as an investigation. That can help you to set the paper up for a results section that will reveal what you have learned.
How to Imagine Research as an Investigation
What questions do you have about your topic? How can you get curious about the subject if it's something you at first think is boring? The key to writing the results of the research is having a question to investigate in the first place. If you need to do a research paper on something having to do with Italy, get curious about Italy. What about Italy is interesting to you? If you can choose the topic yourself, try to find something about the topic that engages you or makes you think and ask questions.
If the topic of your paper has something to do with science, and you really dislike science, this is an opportunity to get curious. Do you need to do an experiment demonstrating that sponges soak up water? Why might that be interesting or important? These are great places to begin.
Getting curious about the topic you are researching is critical. Getting curious can help you connect to the research and can make the experience more unique and interesting than it would ever have been otherwise. It can also make your research paper stand out as being distinctly yours. A lot of people can write a lazy summary of something, but only you can bring your individuality to the proceedings and use it as a lens to guide your research.
How Do I Structure a Research Paper?
The structure of a research paper or a lab report on an experiment is critical. Because research is scientific, you want to be as meticulous as possible so that all the necessary information is conveyed. You will want to begin your paper by explaining why the topic you are pursuing is worth researching. Explain why it interests you.
Explain what you hope to gain from conducting this research or this experiment. Tell the reader what your hypothesis is and explain why you've come to believe this to be true. Next, lay out your strategy or methodology. What are you going to do in this paper?
How are you planning to discover whether or not your hypothesis is correct? Explain your plan for figuring out whether your hypothesis is correct or explain the way that you decided to research the topic. Offer a list of resources that you consulted. Make it clear why you chose to go about the research in the way that you did.
What Sections Does a Research Paper Have?
Typically, a research paper has five major parts:
- Introduction
- Review of literature
The introduction is the section of the research paper where you introduce the question you are looking to investigate and explain why you are doing so. If there are statistics or quotes or other writing you have found that lends itself to supporting your investigation, you can introduce it here. For example, if you are writing about whether or not the Loch Ness monster is real, you can share quotes or statistics about the number of times that people have said they've seen it.
The next section of the paper, the review of literature, should be a synthesis of the research that you've done thus far that has informed your hypothesis. Gather and summarize the information that has led you to this point and make it clear that going into your research, you were aware of this literature, and you used it to develop your methods. In the methods section, you will begin to detail the way that you went about conducting your experiment or conducting your research.
What Is the Results and Discussion Section?
The results and discussion pieces are the two most critical parts of the research paper. This tells us in factual terms exactly what you discovered. The results section is not the place for analysis. The results section is not the place for narrative discussion or emotion either. The results section is only for the results of the research.
The results section provides the facts about what you discovered in the course of your research or experiment. The discussion section is where you can get analytical or reflective about exactly what you have discovered. This is the place where you can tell us what the results mean. Does it mean that your hypothesis was correct, or does it mean that you need to do further research or experiments before you can come to a definitive conclusion about this issue?
How Do You Write the Results of the Research?
In the results section of your paper, you need to list what you have discovered. If your experiment confirmed your hypothesis, save the discussion about that for the discussion section. The results section should simply be hard facts written in the passive voice.
Many students get confused between the active and passive voices when writing a research paper. Unlike the rest of the paper, the results section should be written in the passive voice in order to draw attention to the action and not to the person performing the action.
Once you have clearly defined what your experiment or research has yielded, you can move on to the discussion section.
How Do You Write the Discussion Section?
The discussion section is where you can analyze and make inferences about your research or your experiment. Tell the reader what it means to you now that your hypothesis was confirmed or proved to be incorrect. Moreover, what does it mean for the future of this research?
If your hypothesis was proven to be correct, can that be brought to bear on any other research or hypotheses? If your experiment was wholly inconclusive, can you say why that was? What went wrong? Is it something that could be corrected?
In What Tone Should You Write a Research Paper?
Many people who read research papers, including teachers, editors and professors, hate the passive voice. They consider the passive voice to be an example of poor writing. Many colleges have writing centers where they can help students to improve the quality of their writing, and one of the tasks they face most often is getting students out of the passive voice.
A sentence written in the active voice shows the subject acting on a direct object. "David mailed the package" is an example of a sentence in the active voice. On the contrary, a sentence written in the passive voice shows the object being acted on by a verb. An example is: "The package was mailed by David."
While technically the passive voice is not grammatically incorrect – and in some cases, given literary license, it is necessary – the passive voice is considered an example of less-than-ideal writing. Active and passive voice can change the quality of a piece of writing, particularly academic writing. If you find that you have written any sentences in your research paper in the passive voice anywhere other than in the results section, it is a good rule of thumb to go back and do a passive-to-active conversion.
What Part of My Research Paper Should Be in the Passive Voice?
The passive voice is not gramatically incorrect. It is used correctly when the intention of the sentence is to draw attention to the action and not the person performing the action. This is why when you write the results section of the research paper, you will want to employ the passive voice.
The passive voice tells us that the results of the experiment or the research are more important in this instance than the way that the research was carried out. Said another way, the results section is not about you. It is not about the way that you performed the research or the way that you set up the experiment. It is purely and simply about the results.
What Are Some Active and Passive Voice Rules?
There are some tips to make sure that you are writing in the active voice. However, keep in mind that in some cases, such as in the results section, you will need to use the passive voice. After all, if you talk about something that happened in the past or that happened to someone, you will need to use words like "was" and "had."
Sometimes, it can be effective to make something passive. For example, the phrase "the city of Rome was attacked by invaders" shows that the subject of the sentence is Rome and that is the thing that is being acted on, even if it is in a passive sense. "Invaders attacked the city of Rome" turns the focus to the invaders. A reader may well expect the following sentence to be about the invaders.
Pay close attention to the subject in the sentence. Is the subject the one carrying out the activities described in the verb? If not, go back and fix it.
Related Articles

How to Write an Investigation Essay

How to Make a Strong Argument in an Essay

How to Write a Lab Report

How to Write a Nursing Abstract

How to write a humanities paper

How to Do a Summary of a News Article

How to Write a Dissertation Summary

How to Write a Thesis Statement for "Robinson Crusoe"
- Towson University: Active/Passive Voice
- College of Western Idaho: What Are the Differences Between Active and Passive Voice?
- University of Wisconsin-Madison Writing Center: Use the Active Voice
- A Research Guide For Students: How to Write a Research Paper
- American Psychological Association
- Try starting this section by creating an outline of each hypothesis or research question followed by each statistical test you will use for it.
- Where relevant, state the effect size of the particular statistical test.
- Only include statistical tests that are relevant to your particular hypotheses or research questions. Excessive irrelevant statistical tests detract from the big picture and make it difficult for the reader to follow.
- Do not include specific calculations used to determine the statistic.
Ashley Friedman is a freelance writer with experience writing about education for a variety of organizations and educational institutions as well as online media sites. She has written for Pearson Education, The University of Miami, The New York City Teaching Fellows, New Visions for Public Schools, and a number of independent secondary schools. She lives in Los Angeles.
- How It Works
- PhD thesis writing
- Master thesis writing
- Bachelor thesis writing
- Dissertation writing service
- Dissertation abstract writing
- Thesis proposal writing
- Thesis editing service
- Thesis proofreading service
- Thesis formatting service
- Coursework writing service
- Research paper writing service
- Architecture thesis writing
- Computer science thesis writing
- Engineering thesis writing
- History thesis writing
- MBA thesis writing
- Nursing dissertation writing
- Psychology dissertation writing
- Sociology thesis writing
- Statistics dissertation writing
- Buy dissertation online
- Write my dissertation
- Cheap thesis
- Cheap dissertation
- Custom dissertation
- Dissertation help
- Pay for thesis
- Pay for dissertation
- Senior thesis
- Write my thesis
Results Section Of A Research Paper: How To Write It Properly

The results section of a research paper refers to the part that represents the study’s core findings from the methods that the researcher used to collect and analyze data. This section presents the results logically without interpretation or bias from the author.
Thus, this part of a research paper sets up the read for evaluation and analysis of the findings in the discussion section. Essentially, this section breaks down the information into several sentences, showing its importance to the research question. Writing results section in a research paper entails summarizing the gathered data and the performed statistical analysis. That way, the author presents or reports the results without subjective interpretation.
What Is The Results Section Of A Research Paper?
In its simplest definition, a research paper results section is where the researcher reports the findings of a study based on the applied methodology for gathering information. It’s the part where the author states the research findings in a logical sequence without interpreting them. If the research paper has data from actual research, this section should feature a detailed description of the results.
When writing a dissertation, a thesis, or any other academic paper, the result section should come third in sections’ sequence. It should follow the Methods and Materials presentation and the Discussion section comes after it. But most scientific papers present the Results and Discussion sections together. However, the results section answers the question, “What did your research uncover?”
Ideally, this section allows you to report findings in research paper, creating the basis for sufficiently justified conclusions. After writing the study findings in the results section, you interpret them in the subsequent discussion part. Therefore, your results section should report information that will justify your claims. That way, you can look back on the results section when writing the discussion part to ensure that your report supports your conclusions.
What Goes in the Results Section of a Research Paper?
This section should present results in research paper. The findings part of a research paper can differ in structure depending on the study, discipline, and journal. Nevertheless, the results section presents a description of the experiment while presenting the research results. When writing this part of your research paper, you can use graphs and tables if necessary.
However, state the findings without interpreting them. For instance, you can find a correlation between variables when analyzing data. In that case, your results section can explain this correlation without speculating about the causes of this correlation.
Here’s what to include in the results section of research paper:
A brief introductory of the context, repeating the research questions to help the readers understand the results A report about information collection, participants, and recruitment: for instance, you can include a demographic summary with the participants’ characteristics A systematic findings’ description, with a logical presentation highlighting relevant and crucial results A contextual data analysis explaining the meaning in sentences Information corresponding to the primary research questions Secondary findings like subgroup analysis and secondary outcomes Visual elements like charts, figures, tables, and maps, illustrating and summarizing the findings
Ensure that your results section cites and numbers visual elements in an orderly manner. Every table or figure should stand alone without text. That means visual elements should have adequate non-textual content to enable the audiences to understand their meanings.
If your study has a broad scope, several variables, or used methodologies that yielded different results, state the most relevant results only based on the research question you presented in your Introduction section.
The general rule is to leave out any data that doesn’t present your study’s direct outcome or findings. Unless the professor, advisor, university faulty, or your target journal requests you to combine the Results and Discussion sections, omit the interpretations and explanations of the results in this section.
How Long Should A Results Section Be?
The findings section of a research paper ranges between two and three pages, with tables, text, and figures. In most cases, universities and journals insist that this section shouldn’t exceed 1,000 words over four to nine paragraphs, usually with no references.
But a good findings section occupies 5% of the entire paper. For instance, this section should have 500 words if a dissertation has 10,000 words. If the educator didn’t specify the number of words to include in this chapter, use the data you collect to determine its length. Nevertheless, be as concise as possible by featuring only relevant results that answer your research question.
How To Write Results Section Of Research Paper
Perhaps, you have completed researching and writing the preceding sections, and you’re now wondering how to write results. By the time you’re composing this section, you already have findings or answers to your research questions. However, you don’t even know how to start a results section. And your search for guidelines landed you on this page.
Well, every research project is different and unique. That’s why researchers use different strategies when writing this section of their research papers. The scientific or academic discipline, specialization field, target journal, and the author are factors influencing how you write this section. Nevertheless, there’s a general way of writing this section, although it might differ slightly between disciplines. Here’s how to write results section in a research paper.
Check the instructions or guidelines. Check their instructions or guidelines first, whether you’re writing the research paper as part of your coursework or for an academic journal. These guidelines outline the requirements for presenting results in research papers. Also, check the published articles to know how to approach this section. When reviewing the procedures, check content restrictions and length. Essentially, learn everything you can about this section from the instructions or guidelines before you start writing. Reflect on your research findings. With instructions and guidelines in mind, reflect on your research findings to determine how to present them in your research paper. Decide on the best way to show the results so that they can answer the research question. Also, strive to clarify and streamline your report, especially with a complex and lengthy results section. You can use subheadings to avoid peripheral and excessive details. Additionally, consider breaking down the content to make it easy for the readers to understand or remember. Your hypothesis, research question, or methodologies might influence the structure of the findings sections. Nevertheless, a hierarchy of importance, chronological order, or meaningful grouping of categories or themes can be an effective way of presenting your findings. Design your visual presentations. Visual presentations improve the textual report of the research findings. Therefore, decide on the figures and styles to use in your tables, graphs, photos, and maps. However, check the instructions and guidelines of your faculty or journal to determine the visual aids you can use. Also, check what the guidelines say about their formats and design elements. Ideally, number the figures and tables according to their mention in the text. Additionally, your figures and tables should be self-explanatory. Write your findings section. Writing the results section of a research paper entails communicating the information you gathered from your study. Ideally, be as objective and factual as possible. If you gathered complex information, try to simplify and present it accurately, precisely, and clearly. Therefore, use well-structured sentences instead of complex expressions and phrases. Also, use an active voice and past tense since you’ve already done the research. Additionally, use correct spelling, grammar, and punctuation. Take your time to present the findings in the best way possible to focus your readers on your study objectives while preparing them for the coming speculations, interpretations, and recommendations. Edit Your Findings Section. Once you’ve written the results part of your paper, please go through it to ensure that you’ve presented your study findings in the best way possible. Make sure that the content of this section is factual, accurate, and without errors. You’ve taken a considerable amount of time to compose the results scientific paper audiences will find interesting to read. Therefore, take a moment to go through the draft and eliminate all errors.
Practical Tips on How to Write a Results Section of a Research Paper
The results part of a research paper aims to present the key findings objectively in a logical and orderly sequence using text and illustrative materials. A common mistake that many authors make is confusing the information in the discussion and the results sections. To avoid this, focus on presenting your research findings without interpreting them or speculating about them.
The following tips on how to write a results section should make this task easier for you:
Summarize your study results: Instead of reporting the findings in full detail, summarize them. That way, you can develop an overview of the results. Present relevant findings only: Don’t report everything you found during your research. Instead, present pertinent information only. That means taking time to analyze your results to know what your audiences want to know. Report statistical findings: When writing this section, assume that the audiences understand statistical concepts. Therefore, don’t try to explain the nitty-gritty in this section. Remember that your work is to report your study’s findings in this section. Be objective and concise: You can interpret the findings in the discussion sections. Therefore, focus on presenting the results objectively and concisely in this section. Use the suitable format: Use the correct style to present the findings depending on your study field.
Get Professional Help with the Research Section
Maybe you’re pursuing your graduate or undergraduate studies but cannot write the results part of your paper. Perhaps, you’re done researching and analyzing information, but this section proves too tricky for you to write. Well, you’re not alone because many students across the world struggle to present their research findings.
Luckily, our highly educated, talented, and experienced writers are always ready to assist such learners. If you are stuck with the results part of your paper, our professionals can help you . We offer high-quality, custom writing help online. We’re a reliable team of experts with a sterling reputation for providing comprehensive assistance to college, high school, and university learners. We deliver highly informative academic papers after conducting extensive and in-depth research. Contact us saying something like, “please do my thesis” to get quality help with your paper!

Leave a Reply Cancel reply
Your email address will not be published. Required fields are marked *
Comment * Error message
Name * Error message
Email * Error message
Save my name, email, and website in this browser for the next time I comment.
As Putin continues killing civilians, bombing kindergartens, and threatening WWIII, Ukraine fights for the world's peaceful future.
Ukraine Live Updates
- Services Paper editing services Paper proofreading Business papers Philosophy papers Write my paper Term papers for sale Term paper help Academic term papers Buy research papers College writing services Paper writing help Student papers Original term papers Research paper help Nursing papers for sale Psychology papers Economics papers Medical papers Blog

Writing The Results Section Of A Research Paper

The results section of a research paper is important because it is where students report the findings of a research study established on the gathered information from the methodology applied in the study. The findings section of a research paper should state the facts without any interpretation or bias. The research paper results section should use the past-tense. It should also be placed after the introduction, literature review, and research methodology. This way the reader can refocus his or her attention back to the main purpose of the study.
The goal of a results section of a research paper APA is to reject or confirm the research question or questions that make the foundation of your study. The results don’t prove anything. The results help you articulate the findings to aid you in understanding the research problem from inside and consider it from different perspectives.
Results Section of a Research Paper: Basic Facts
The length of the results section of research paper varies on the size of the study and the amount of information you have to report on. It’s a good idea to use visual elements such as charts and graphs to provide factual information. You will need to decide which visual elements to include in the results section and which can be included in an appendix.
The best way to write the results in research paper is to avoid putting in content that is not important towards providing an answer to the research questions. Use the introduction to provide any background material to put your study into context, and then stay within this context when you give the results.
The results are considered the core section of a research paper and should include only factual statements that convey the information gathered from your study, even if it does not prove your original theories. Variables can be addressed if they had a noticeable positive or negative effect on outcomes. And all statistics that are included should represent the research problem.
Do you want to write a paper that will impress the tutor to award you the top grade? A great way to learn how to format and arrange this section is to find a well-written results section of a research paper example. You can find hundreds of them at your school library in journals or on the web using an online academic database.
How to Write the Results Section of a Research Paper
One of the most common questions we get from students throughout the year seeks to find out how to write a results section for a research paper. A great place to start research paper results is to restate the purpose and objective of your study. This encourages your reader to focus on the core of the research paper.
Before we provide instructions for how to write results section of research paper, you must recall that all academic writing should be impartial. Present the results objectively in an unbiased manner. Only this way can you make your findings credible.
Report information to adequately justify what you conclude about the study. Your findings may not be in complete support of your hypothesis, but this is okay. What is most important is that you provide factual information and then provide your analysis of the data, even if the study did not go the way you predicted.
The methodology is the section that comes before the results section, so there is no need to repeat the information you included there. It is also unnecessary to describe each step of the process you used to gather statistics. Your reader will likely know all of the nuances such as rejection rules, null hypotheses, and so on that it is not necessary to remind him or her of them.
When you are writing the results, you must be sure not to include the raw data you gathered in your research study. You need to summarize the results without reporting them in full detail. Provide a brief overview. There is no need to give every calculation and result. Many students find that it’s a good idea to post a supplemental archive page on the web for those that want to see the full detail. You can do a simple web search to find a supplemental example of results section of research paper.
The research paper results section should include everything that will justify your claims adequately. It should be truthful and present an accurate view of what you discovered in your research study. This is true even if the results research paper does not align with your original hypothesis. Just because the results do not line up with your ideas, does not mean that the data is not useful for you or somebody else.
You should always assume that the reader will have a well-rounded understanding of the information you are reporting, so it is unnecessary to explain precisely what specific tests looks for or how something in your study works. Your sole responsibility is to present the results of your research study. If you look at a research paper results example, you will find that using different text effects will highlight the importance of your research and its results.
If you are just learning how to write a results section of a research paper you should know that it’s always a good idea to include a combination of figures and tables, especially when the data that is being presented can be conveyed more effectively with a visual tool. You should select the ones that directly refer to the research problem. Any other figures and tables can be included in the appendix. Always number figures and tables separately using a consistent method (e.g., Figure 1, Figure 1.1, Figure 2, Figure 2.2, etc.). Be sure that you do not present the same information twice in your figures and tables. If you need to refer to information twice, just refer to the first visual.
The discussion is what follows the results section using APA guidelines. It a good idea to go to the library to read a few journal articles in your discipline to get a sense of how your research paper should be structured. Be sure to always use the past tense, be concise and objective, and don’t hesitate to get a second opinion from a teacher, tutor, or anyone else that is familiar with this type of writing.
If you want a well-written results section of research paper example, we have several resources that can help. Contact us for professional writing help . If you need to speak with an academic expert that specializes in your area of study, we can connect you with the right person to address your needs in a matter of hours. And if you still don’t know how to write a results section of a research paper, we can esit, revise, and write an assignment for you . Just reach out to us by chat, email, or phone any time of the day and we will help you with school papers.

Leave a Reply Cancel reply
Your email address will not be published. Required fields are marked *
Save my name, email, and website in this browser for the next time I comment.
Terms & Conditions Loyalty Program Privacy Policy Money-Back Policy
Copyright © 2013-2024 MyPaperDone.com
- Expert Journal of Finance
- Expert Journal of Economics
- Expert Journal of Marketing
- Expert Journal of Business and Management
- Send Your Article
- Google Plus
How to Write the Results Section of a Research Paper
This article is part of an ongoing series on academic writing help of scholarly articles. Previous parts explored how to write an introduction for a research paper , literature review outline and format , and how to write a research methodology .
Academics and researchers publish their scholarly articles to show the results they have obtained using gathered or collected data. Research papers present the process of testing hypotheses or models and how their findings help shape or advance a particular research topic. Thus, the ‘Results’ section is essential in expressing the significance of an academic article.
The findings of your research should be included in a separate section of your academic article, as it is the only section that contains data and results.
Aspects to Consider in Writing the Results Section of a Research Paper
A good place to start for your results section, it’s to restate the aim and objective of your research paper , so that your readers can refocus on the core of your academic article. So far in your research paper, your readers covered the introduction , literature review , research methodology and now it’s the time and place to bring their attention back to the purpose. A short paragraph is sufficient to restate your paper’s purpose.
Then, it’s key to consider that this is main section of your research paper where you present and explain the data you have collected or gathered and the findings of your data analysis and interpretation .
The academic writing should be clear, impartial, and objective . Each result, which confirms or refutes your assumptions, should be noted in an unbiased manner to increase the credibility of your study.
The results section gives you the opportunity to:
- summarize the collected data in the form of descriptive statistics and
- report on the findings from relevant and appropriate inferential statistical analyses and interpretation that are aimed at answering your academic article’s research questions or supporting your hypotheses, and show your research significance.
For an organized Research Results section, it’s best to use sub-sections. These sub-sections or divisions can be based on:
- Your research questions, hypotheses or models , or
- The statistical tests you have conducted.
How to Clearly Report Your Research Findings
If you have used statistical analyses in your academic article, and found answers to your research questions, report those facts in relation to your question.
A clear, coherent presentation of your research paper’s results should exhibit logical explanations without bias.
Confirming or Rejecting Hypotheses in Your Research Results
While defining the section of your research’s outcomes area, it’s important to keep in mind that the research results do not prove or demonstrate anything.
Your research findings can only affirm/ confirm or reject the hypotheses and assumptions elaborated upon in your academic article. In any case, your results:
- help with the understanding of a research problem from within,
- assist in dividing the research problem into different parts and concepts,
- add to the exploration of an issue from various vantage points.
Summarizing Key Findings in Your Results Section
In a coherent results presentation, you should:
- offer summarizing notes of your outcomes and
- save the explanations of your key discoveries for your Discussion section.
For example, in your empirical analysis you notice an uncommon correlation between two variables. In the Results section, it is okay to bring up this outcome, however, posing new hypotheses for this uncommon result should be presented in the Discussion section.
Using Tables and Figures to Highlight Research Results
Any valuable academic article should focus on using tables, figures and/or graphs to:
- provide accurate views about the research findings,
- summarize the analysis,
- help with the interpretation of these outcomes, and
- offer better understanding of the overall study.
Instead of using only descriptive text for your scholarly article, consider other visual ways and representations that improve the academic writing of your research paper.
Figures, tables and graphs are useful methods for gathering a great deal of information into one place that can then be mentioned in the content of your article. If any research question or hypothesis is confirmed by your data and analysis, you can point to a table or figure that illustrates your finding.
When you present tables or figures in your results section, make sure to describe at least some of the data included in these visual representations so that readers can clearly understand how the table works and what interpretations can be concluded from them.
You can also use appendices if you have many other helpful figures or tables that cannot be fully included in the text of your academic article.
By using a helpful combination of text, figures, and tables, you, as Authors and Academics, can use this section to effectively share your studies’ findings with the scientific community.
Presenting Research Findings and Statistical Significance
A systematic description of your research results and a correct data analysis and interpretation are related to statistical significance, as they help avoid speculations or misinterpretations by readers of your academic article.
In a valuable research paper:
- data must be directly and clearly presented,
- statistical tests need to be used, and
- the figures obtained and included in the study have to be explained.
Tests of statistical significance should always be presented with your results to show that your research findings objectively confirm or disprove your hypotheses. You need to report the research results with enough details so that readers can see which statistical analyses were conducted and validated to justify or disprove your hypotheses. It is important to mention relevant research findings, including those that were are statistical insignificant, not validated within your model’s framework, and are at odds with your initial assumptions.
Even if not all of your research results are confirmed, you should not ignore them. These negative results that do not support a particular hypothesis should be noted in the results section, and then explained in the Discussion section.
Writing a Research Results section that do not address the negative results, invalidates the research paper and does not reflect appropriate academic writing.
Research Results Comparison with Similar Academic Articles
The largest part of interpreting and discussing your research findings should be reserved for the Discussion / Conclusion section.
However, there are instances when it is appropriate to compare or contrast your results with findings from previous and similar studies. For example:
- Similar to Author [Year], one of the findings of this study is the strong relationship between…
- While Author [Year] found an indirect relationship between, our study highlighted ….
Key Aspects for Your Research Results Section
For a good structure and organization of your research, keep in mind these aspects:
- Start your research results section by restating the purpose of your research, so that your readers can re-focus on core of your academic article
- Include helpful and quality tables, figures, graphs that can synthesize your research
- Make sure you include details about your data analysis and interpretation, as well as statistical significance tests
- Report the statistical insignificant research findings for your academic article’s credibility
- Use the past tense when describing to your research results
- Do not use vague terms and be as concise as possible when you are reporting your research findings
- Conclude your section with a short paragraph that summarizes your study’s key outcomes.
Which aspects do you focus on when writing your research results section?
This blog series focuses on useful academic writing tips. Next, we examine the Discussion and Conclusion section . Find our more on writing high-quality research papers
You may also like
Related policies and links, responsibilities of the publisher in the relationship with journal editors, general duties of publisher.

Get science-backed answers as you write with Paperpal's Research feature
How to Write an Abstract in Research Papers (with Examples)

An abstract in research papers is a keyword-rich summary usually not exceeding 200-350 words. It can be considered the “face” of research papers because it creates an initial impression on the readers. While searching databases (such as PubMed) for research papers, a title is usually the first selection criterion for readers. If the title matches their search criteria, then the readers read the abstract, which sets the tone of the paper. Titles and abstracts are often the only freely available parts of research papers on journal websites. The pdf versions of full articles need to be purchased. Journal reviewers are often provided with only the title and abstract before they agree to review the complete paper. [ 1]
Abstracts in research papers provide readers with a quick insight into what the paper is about to help them decide whether they want to read it further or not. Abstracts are the main selling points of articles and therefore should be carefully drafted, accurately highlighting the important aspects. [ 2]
This article will help you identify the important components and provide tips on how to write an abstract in research papers effectively
What is an Abstract?
An abstract in research papers can be defined as a synopsis of the paper. It should be clear, direct, self-contained, specific, unbiased, and concise. These summaries are published along with the complete research paper and are also submitted to conferences for consideration for presentation.
Abstracts are of four types and journals can follow any of these formats: [ 2]
- Structured
- Unstructured
- Descriptive
- Informative
Structured abstracts are used by most journals because they are more organized and have clear sections, usually including introduction/background; objective; design, settings, and participants (or materials and methods); outcomes and measures; results; and conclusion. These headings may differ based on the journal or the type of paper. Clinical trial abstracts should include the essential items mentioned in the CONSORT (Consolidated Standards Of Reporting Trials) guidelines.
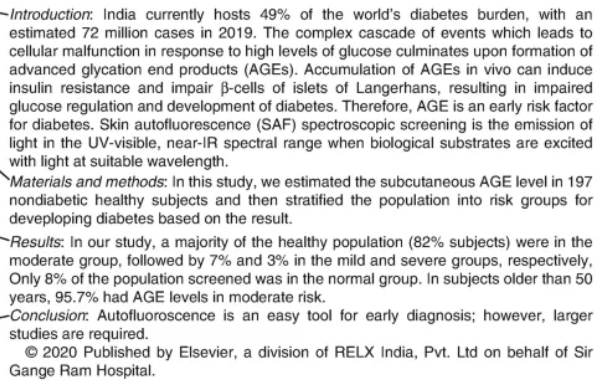
Figure 1. Structured abstract example [3]
Unstructured abstracts are common in social science, humanities, and physical science journals. They usually have one paragraph and no specific structure or subheadings. These abstracts are commonly used for research papers that don’t report original work and therefore have a more flexible and narrative style.
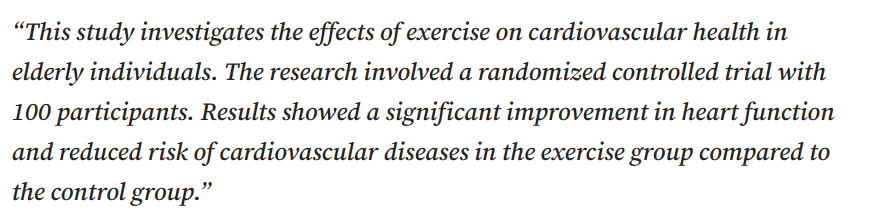
Figure 2. Unstructured abstract example [3]
Descriptive abstracts are short (75–150 words) and provide an outline with only the most important points of research papers. They are used for shorter articles such as case reports, reviews, and opinions where space is at a premium, and rarely for original investigations. These abstracts don’t present the results but mainly list the topics covered.
Here’s a sample abstract . [ 4]
“Design of a Radio-Based System for Distribution Automation”
A new survey by the Maryland Public Utilities Commission suggests that utilities have not effectively explained to consumers the benefits of smart meters. The two-year study of 86,000 consumers concludes that the long-term benefits of smart meters will not be realized until consumers understand the benefits of shifting some of their power usage to off-peak hours in response to the data they receive from their meters. The study presents recommendations for utilities and municipal governments to improve customer understanding of how to use the smart meters effectively.
Keywords: smart meters, distribution systems, load, customer attitudes, power consumption, utilities
Informative abstracts (structured or unstructured) give a complete detailed summary, including the main results, of the research paper and may or may not have subsections.

Figure 3. Informative abstract example [5]
Purpose of Abstracts in Research
Abstracts in research have two main purposes—selection and indexing. [ 6,7]
- Selection : Abstracts allow interested readers to quickly decide the relevance of a paper to gauge if they should read it completely.
- Indexing : Most academic journal databases accessed through libraries enable you to search abstracts, allowing for quick retrieval of relevant articles and avoiding unnecessary search results. Therefore, abstracts must necessarily include the keywords that researchers may use to search for articles.
Thus, a well-written, keyword-rich abstract can p ique readers’ interest and curiosity and help them decide whether they want to read the complete paper. It can also direct readers to articles of potential clinical and research interest during an online search.

Contents of Abstracts in Research
Abstracts in research papers summarize the main points of an article and are broadly categorized into four or five sections. Here are some details on how to write an abstract .
Introduction/Background and/or Objectives
This section should provide the following information:
- What is already known about the subject?
- What is not known about the subject or what does the study aim to investigate?
The hypothesis or research question and objectives should be mentioned here. The Background sets the context for the rest of the paper and its length should be short so that the word count could be saved for the Results or other information directly pertaining to the study. The objective should be written in present or past simple tense.
Examples:
The antidepressant efficacy of desvenlafaxine (DV) has been established in 8-week, randomized controlled trials. The present study examined the continued efficacy of DV across 6 months of maintenance treatment . [ 1]
Objective: To describe gastric and breast cancer risk estimates for individuals with CDH1 variants.
Design, Setting, and Participants (or Materials and Methods)
This section should provide information on the processes used and should be written in past simple tense because the process is already completed.
A few important questions to be answered include:
- What was the research design and setting?
- What was the sample size and how were the participants sampled?
- What treatments did the participants receive?
- What were the data collection and data analysis dates?
- What was the primary outcome measure?
Hazard ratios (HRs) were estimated for each cancer type and used to calculate cumulative risks and risks per decade of life up to age 80 years.
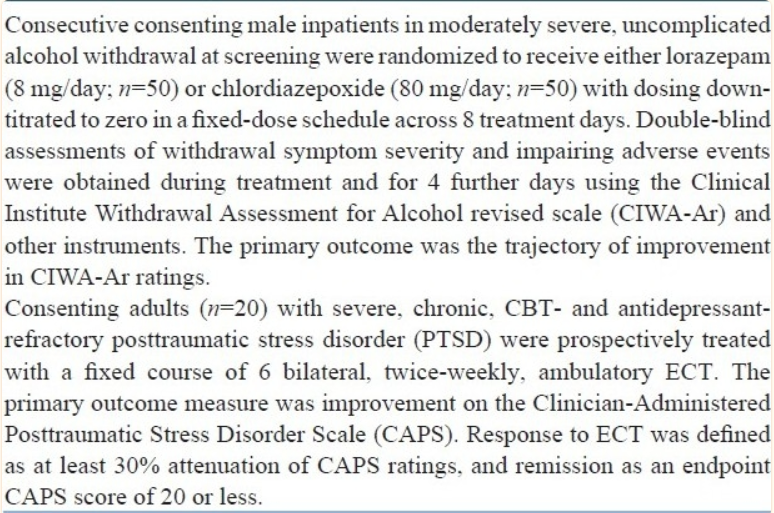
This section, written in either present or past simple tense, should be the longest and should describe the main findings of the study. Here’s an example of how descriptive the sentences should be:
Avoid: Response rates differed significantly between diabetic and nondiabetic patients.
Better: The response rate was higher in nondiabetic than in diabetic patients (49% vs 30%, respectively; P<0.01).
This section should include the following information:
- Total number of patients (included, excluded [exclusion criteria])
- Primary and secondary outcomes, expressed in words, and supported by numerical data
- Data on adverse outcomes
Example: [ 8]
In total, 10.9% of students were reported to have favorable study skills. The minimum score was found for preparation for examination domain. Also, a significantly positive correlation was observed between students’ study skills and their Grade Point Average (GPA) of previous term (P=0.001, r=0.269) and satisfaction with study skills (P=0.001, r=0.493).
Conclusions
Here, authors should mention the importance of their findings and also the practical and theoretical implications, which would benefit readers referring to this paper for their own research. Present simple tense should be used here.
Examples: [ 1,8]
The 9.3% prevalence of bipolar spectrum disorders in students at an arts university is substantially higher than general population estimates. These findings strengthen the oft-expressed hypothesis linking creativity with affective psychopathology.
The findings indicated that students’ study skills need to be improved. Given the significant relationship between study skills and GPA, as an index of academic achievement, and satisfaction, it is necessary to promote the students’ study skills. These skills are suggested to be reinforced, with more emphasis on weaker domains.

When to Write an Abstract
In addition to knowing how to write an abstract , you should also know when to write an abstract . It’s best to write abstracts once the paper is completed because this would make it easier for authors to extract relevant parts from every section.
Abstracts are usually required for: [ 7]
- submitting articles to journals
- applying for research grants
- writing book proposals
- completing and submitting dissertations
- submitting proposals for conference papers
Mostly, the author of the entire work writes the abstract (the first author, in works with multiple authors). However, there are professional abstracting services that hire writers to draft abstracts of other people’s work.
How to Write an Abstract (Step-by-Step Process)
Here are some key steps on how to write an abstract in research papers: [ 9]
- Write the abstract after you’ve finished writing your paper.
- Select the major objectives/hypotheses and conclusions from your Introduction and Conclusion sections.
- Select key sentences from your Methods section.
- Identify the major results from the Results section.
- Paraphrase or re-write the sentences selected in steps 2, 3, and 4 in your own words into one or two paragraphs in the following sequence: Introduction/Objective, Methods, Results, and Conclusions. The headings may differ among journals, but the content remains the same.
- Ensure that this draft does not contain: a. new information that is not present in the paper b. undefined abbreviations c. a discussion of previous literature or reference citations d. unnecessary details about the methods used
- Remove all extra information and connect your sentences to ensure that the information flows well, preferably in the following order: purpose; basic study design, methodology and techniques used; major findings; summary of your interpretations, conclusions, and implications. Use section headings for structured abstracts.
- Ensure consistency between the information presented in the abstract and the paper.
- Check to see if the final abstract meets the guidelines of the target journal (word limit, type of abstract, recommended subheadings, etc.) and if all the required information has been included.
Choosing Keywords for Abstracts
Keywords [ 2] are the important and repeatedly used words and phrases in research papers and can help indexers and search engines find papers relevant to your requirements. Easy retrieval would help in reaching a wider audience and eventually gain more citations. In the fields of medicine and health, keywords should preferably be chosen from the Medical Subject Headings (MeSH) list of the US National Library of Medicine because they are used for indexing. These keywords need to be different from the words in the main title (automatically used for indexing) but can be variants of the terms/phrases used in the title, abstract, and the main text. Keywords should represent the content of your manuscript and be specific to your subject area.
Basic tips for authors [ 10,11]
- Read through your paper and highlight key terms or phrases that are most relevant and frequently used in your field, to ensure familiarity.
- Several journals provide instructions about the length (eg, 3 words in a keyword) and maximum number of keywords allowed and other related rules. Create a list of keywords based on these instructions and include specific phrases containing 2 to 4 words. A longer string of words would yield generic results irrelevant to your field.
- Use abbreviations, acronyms, and initializations if these would be more familiar.
- Search with your keywords to ensure the results fit with your article and assess how helpful they would be to readers.
- Narrow down your keywords to about five to ten, to ensure accuracy.
- Finalize your list based on the maximum number allowed.
Few examples: [ 12]
| Direct observation of nonlinear optics in an isolated carbon nanotube | molecule, optics, lasers, energy lifetime | single-molecule interaction, Kerr effect, carbon nanotube, energy level |
| Region-specific neuronal degeneration after okadaic acid administration | neuron, brain, regional-specific neuronal degeneration, signaling | neurodegenerative diseases; CA1 region, hippocampal; okadaic acid; neurotoxins; MAP kinase signaling system; cell death |
| Increases in levels of sediment transport at former glacial-interglacial transitions | climate change, erosion, plant effects | quaternary climate change, soil erosion, bioturbation |
Important Tips for Writing an Abstract
Here are a few tips on how to write an abstract to ensure that your abstract is complete, concise, and accurate. [ 1,2]
- Write the abstract last.
- Follow journal-specific formatting guidelines or Instructions to Authors strictly to ensure acceptance for publication.
- Proofread the final draft meticulously to avoid grammatical or typographical errors.
- Ensure that the terms or data mentioned in the abstract are consistent with the main text.
- Include appropriate keywords at the end.
Do not include:
- New information
- Text citations to references
- Citations to tables and figures
- Generic statements
- Abbreviations unless necessary, like a trial or study name

Key Takeaways
Here’s a quick snapshot of all the important aspects of how to write an abstract . [2]
- An abstract in research is a summary of the paper and describes only the main aspects. Typically, abstracts are about 200-350 words long.
- Abstracts are of four types—structured, unstructured, descriptive, and informative.
- Abstracts should be simple, clear, concise, independent, and unbiased (present both favorable and adverse outcomes).
- They should adhere to the prescribed journal format, including word limits, section headings, number of keywords, fonts used, etc.
- The terminology should be consistent with the main text.
- Although the section heading names may differ for journals, every abstract should include a background and objective, analysis methods, primary results, and conclusions.
- Nonstandard abbreviations, references, and URLs shouldn’t be included.
- Only relevant and specific keywords should be used to ensure focused searches and higher citation frequency.
- Abstracts should be written last after completing the main paper.
Frequently Asked Questions
Q1. Do all journals have different guidelines for abstracts?
A1. Yes, all journals have their own specific guidelines for writing abstracts; a few examples are given in the following table. [ 6,13,14,15]
| American Psychological Association | |
| American Society for Microbiology | |
| The Lancet | |
| Journal of the American Medical Association |
Q2. What are the common mistakes to avoid when writing an abstract?
A2. Listed below are a few mistakes that authors may make inadvertently while writing abstracts.
- Copying sentences from the paper verbatim
An abstract is a summary, which should be created by paraphrasing your own work or writing in your own words. Extracting sentences from every section and combining them into one paragraph cannot be considered summarizing.
- Not adhering to the formatting guidelines
Journals have special instructions for writing abstracts, such as word limits and section headings. These should be followed strictly to avoid rejections.
- Not including the right amount of details in every section
Both too little and too much information could discourage readers. For instance, if the Background has very little information, the readers may not get sufficient context to appreciate your research. Similarly, incomplete information in the Methods and a text-heavy Results section without supporting numerical data may affect the credibility of your research.
- Including citations, standard abbreviations, and detailed measurements
Typically, abstracts shouldn’t include these elements—citations, URLs, and abbreviations. Only nonstandard abbreviations are allowed or those that would be more familiar to readers than the expansions.
- Including new information
Abstracts should strictly include only the same information mentioned in the main text. Any new information should first be added to the text and then to the abstract only if necessary or if permitted by the word limit.
- Not including keywords
Keywords are essential for indexing and searching and should be included to increase the frequency of retrieval and citation.
Q3. What is the difference between abstracts in research papers and conference abstracts? [16]
A3. The table summarizes the main differences between research and conference abstracts.
| Context | Concise summary of ongoing or completed research presented at conferences | Summary of full research paper published in a journal |
| Length | Shorter (150-250 words) | Longer (150-350 words) |
| Audience | Diverse conference attendees (both experts & people with general interest) | People or other researchers specifically interested in the subject |
| Focus | Intended to quickly attract interest; provides just enough information to highlight the significance, objectives, and impact; may briefly state methods and results | Deeper insight into the study; more detailed sections on methodology, results, and broader implications |
| Publication venue | Not published independently but included in conference schedules, booklets, etc. | Published with the full research paper in academic journals, conference proceedings, research databases, etc. |
| Citations | Allowed | Not allowed |
Thus, abstracts are essential “trailers” that can market your research to a wide audience. The better and more complete the abstract the more are the chances of your paper being read and cited. By following our checklist and ensuring that all key elements are included, you can create a well-structured abstract that summarizes your paper accurately.
References
- Andrade C. How to write a good abstract for a scientific paper or conference presentation. Indian J Psychiatry . 2011; 53(2):172-175. Accessed June 14, 2024. https://www.ncbi.nlm.nih.gov/pmc/articles/PMC3136027/
- Tullu MS. Writing the title and abstract for a research paper: Being concise, precise, and meticulous is the key. 2019; 13(Suppl 1): S12-S17. Accessed June 14, 2024. https://www.ncbi.nlm.nih.gov/pmc/articles/PMC6398294/
- Zawia J. Writing an Academic Paper? Get to know Abstracts vs. Structured Abstracts. Medium. Published October 16, 2023. Accessed June 16, 2024. https://medium.com/@jamala.zawia/writing-an-academic-paper-get-to-know-abstracts-vs-structured-abstracts-11ed86888367
- Markel M and Selber S. Technical Communication, 12 th edition. 2018; pp. 482. Bedford/St Martin’s.
- Abstracts. Arkansas State University. Accessed June 17, 2024. https://www.astate.edu/a/global-initiatives/online/a-state-online-services/online-writing-center/resources/How%20to%20Write%20an%20Abstract1.pdf
- AMA Manual of Style. 11 th edition. Oxford University Press.
- Writing an Abstract. The University of Melbourne. Accessed June 16, 2024. https://services.unimelb.edu.au/__data/assets/pdf_file/0007/471274/Writing_an_Abstract_Update_051112.pdf
- 10 Good Abstract Examples that will Kickstart Your Brain. Kibin Essay Writing Blog. Published April 5, 2017. Accessed June 17, 2024. https://www.kibin.com/essay-writing-blog/10-good-abstract-examples/
- A 10-step guide to make your research paper abstract more effective. Editage Insights. Published October 16, 2013. Accessed June 17, 2024. https://www.editage.com/insights/a-10-step-guide-to-make-your-research-paper-abstract-more-effective
- Using keywords to write your title and abstract. Taylor & Francis Author Services. Accessed June 15, 2024. https://authorservices.taylorandfrancis.com/publishing-your-research/writing-your-paper/using-keywords-to-write-title-and-abstract/
- How to choose and use keywords in research papers. Paperpal by Editage blog. Published March 10, 2023. Accessed June 17, 2024. https://paperpal.com/blog/researcher-resources/phd-pointers/how-to-choose-and-use-keywords-in-research-papers
- Title, abstract and keywords. Springer. Accessed June 16, 2024. https://www.springer.com/it/authors-editors/authorandreviewertutorials/writing-a-journal-manuscript/title-abstract-and-keywords/10285522
- Abstract and keywords guide. APA Style, 7 th edition. Accessed June 18, 2024. https://apastyle.apa.org/instructional-aids/abstract-keywords-guide.pdf
- Abstract guidelines. American Society for Microbiology. Accessed June 18, 2024. https://asm.org/events/asm-microbe/present/abstract-guidelines
- Guidelines for conference abstracts. The Lancet. Accessed June 16, 2024. https://www.thelancet.com/pb/assets/raw/Lancet/pdfs/Abstract_Guidelines_2013.pdf
- Is a conference abstract the same as a paper abstract? Global Conference Alliance, Inc. Accessed June 18, 2024. https://globalconference.ca/is-a-conference-abstract-the-same-as-a-paper-abstract/
Paperpal is a comprehensive AI writing toolkit that helps students and researchers achieve 2x the writing in half the time. It leverages 21+ years of STM experience and insights from millions of research articles to provide in-depth academic writing, language editing, and submission readiness support to help you write better, faster.
Get accurate academic translations, rewriting support, grammar checks, vocabulary suggestions, and generative AI assistance that delivers human precision at machine speed. Try for free or upgrade to Paperpal Prime starting at US$19 a month to access premium features, including consistency, plagiarism, and 30+ submission readiness checks to help you succeed.
Experience the future of academic writing – Sign up to Paperpal and start writing for free!
Related Reads:
- What are Journal Guidelines on Using Generative AI Tools
- How to Write a High-Quality Conference Paper
- Should You Use AI Tools like ChatGPT for Academic Writing?
- What is the Importance of a Concept Paper and How to Write It
How to Write Dissertation Acknowledgements?
Top 7 ai tools for research 2024, you may also like, maintaining academic integrity with paperpal’s generative ai writing..., how to structure an essay, leveraging generative ai to enhance student understanding of..., how to write a good hook for essays,..., addressing peer review feedback and mastering manuscript revisions..., how paperpal can boost comprehension and foster interdisciplinary..., what is the importance of a concept paper..., how to write the first draft of a..., mla works cited page: format, template & examples.
How to Write Background of the Study Section in Research: 3 Tips
Learn how to craft a compelling Background of the Study section for your research paper with these 3 essential tips. Improve your academic writing skills and strengthen your research foundation.
Derek Pankaew
Jun 28, 2024

The background of the study is a crucial section in any research paper. It sets the stage for the research by providing context, explaining the significance, and highlighting the gaps that the study aims to fill. Crafting an effective background section can make a significant difference in how your research is perceived and understood. This article will provide three essential tips for writing a compelling background of the study: establishing the context, identifying the research gap, and justifying the significance of your study.

Tip 1: Establish the Context
Establishing the context is the first step in writing the background of a study. This involves providing a broad overview of the research topic, discussing relevant theories and concepts, and highlighting key studies in the field.
Provide a Broad Overview of the Research Topic
Begin the background by defining the research topic. This broad overview helps readers understand what your study is about and why it is important. Explain the central theme of your research, including the main issues or problems that led to the research. For instance, if your research topic involves an issue in public health, describe the current state of public health, including any prevailing trends, statistics, or significant changes that have occurred over time.
Discuss Relevant Theories and Concepts
Once you have set the stage with a broad overview, delve into the relevant theories and concepts in the literature review section. This section of a research paper should provide a theoretical framework that underpins your study. Discuss major theories that are relevant to your research topic and explain how they relate to your specific research problem or question, providing a solid theoretical base for your study background. This helps to anchor your research within a specific theoretical context, providing a foundation upon which your study in a research paper is built, serving as critical background information.
Highlight Key Studies in the Field
Highlighting key studies is essential for situating your research within the existing body of knowledge. Conduct a literature review to identify significant studies that have been conducted on your research topic. Summarize these studies, focusing on their findings and contributions to the field to enrich the literature review section of your research project. This not only demonstrates your understanding of the existing research but also helps to identify the gaps that your study aims to address, providing a strong background information context.
Tip 2: Identify the Research Gap
Identifying the research gap is a critical component of the background of the study. It involves analyzing existing literature critically, pointing out limitations or unanswered questions in current research, and explaining how your study addresses these gaps.
Analyze Existing Literature Critically
To identify the research gap, you need to analyze the existing literature critically. This involves more than just summarizing previous research; it requires a thorough examination of the strengths and weaknesses of existing studies in the context of your research objectives. Evaluate the methodologies used, the scope of the studies, and the robustness of their findings. This critical analysis will help you to pinpoint areas where further research is needed, thus setting clear research objectives.
Point Out Limitations or Unanswered Questions
Based on your analysis of the literature, identify the limitations or unanswered questions in current research. These could be methodological limitations, gaps in the data, or areas where existing studies have conflicting results. Highlight these gaps clearly, as they form the basis for your specific research problem or question. For example, if previous research has not adequately addressed a specific aspect of your research topic, point this out and explain why it is important to investigate further with a particular research question in mind.
Explain How Your Study Addresses These Gaps
After identifying the research gap, explain how your study aims to address it. Describe the unique approach or methodology that your study employs to fill these gaps, which are often detailed in the literature review section and background information. This section should clearly outline the objectives of your research and how they align with addressing the identified gaps. By doing so, you demonstrate the relevance and importance of your study in advancing the field, which is essential when you write a background.
Tip 3: Justify the Significance of Your Study
Justifying the significance of your study is the final tip for writing an effective background section. This involves explaining the potential impact of your research, connecting your study to real-world applications or problems, and emphasizing the novelty or unique approach of your study mentioned in the introduction section.
Explain the Potential Impact of Your Research
Begin by explaining the potential impact of your research on the background of your study, setting the stage for your research aims. This involves discussing the broader implications of your study and how it contributes to the field of study. Describe how your findings could influence future research, policy-making, or practice. For instance, if your research addresses a significant public health issue, explain how your findings could inform public health policies or interventions.
Connect Your Study to Real-World Applications or Problems
Next, connect your study to real-world applications or problems. This helps to demonstrate the practical relevance of your research, a crucial aspect when you write a research paper to show its significance. Describe specific examples of how your research could be applied in real-world scenarios, illustrating the practical implications in the study background information section. For instance, if your study involves developing a new technology, explain how this technology could be used in industry or by consumers. This connection to real-world applications makes your research more tangible and relevant to a broader audience, demonstrating the potential impact of your research study. When you write a research paper, highlighting these connections can be crucial.
Emphasize the Novelty or Unique Approach of Your Study
Finally, emphasize the novelty or unique approach of your study, which is a key element in the introduction section. Highlight what makes your research different from previous studies and why this is important to understand the research in the context of your research aims. This could involve a novel methodology, a new theoretical perspective, or a unique combination of variables, all contributing to a well-defined research study. By emphasizing the uniqueness of your study, you underscore its contribution to the field and its potential to advance knowledge, specifically addressing a particular research question. This understanding is essential when learning how to write a research study.
In conclusion, writing an effective background for the study is crucial for setting the stage for your research paper. By following these three tips—establishing the context, identifying the research gap, and justifying the significance of your study—you can craft a compelling background section that clearly articulates the importance and relevance of your research. A well-written background not only provides context and justification for your study but also engages your readers and sets the stage for the rest of your research paper.
Easily pronounces technical words in any field
Research Writing
Academic Tips
Background Study
Research Methodology
Scholarly Communication
Recent articles

11 Companies that Offer Internships to Engineering Majors
Amethyst Rayne
Jul 2, 2024
Mentorship programs
Engineering internships
Internship opportunities
Career development

Natural Reader vs Listening.com: Which Text To Speech App is Better?
Glice Martineau

8 Educational Podcasts Every College Student Should Listen To
Jul 3, 2024
Educational podcasts
College student tips
Best podcasts 2024
Student productivity
Personal growth

What are Cool Summer Jobs for College Students? 10 Ideas
Student Employment
Career Advice
College Students
Summer Jobs
Information
- Author Services
Initiatives
You are accessing a machine-readable page. In order to be human-readable, please install an RSS reader.
All articles published by MDPI are made immediately available worldwide under an open access license. No special permission is required to reuse all or part of the article published by MDPI, including figures and tables. For articles published under an open access Creative Common CC BY license, any part of the article may be reused without permission provided that the original article is clearly cited. For more information, please refer to https://www.mdpi.com/openaccess .
Feature papers represent the most advanced research with significant potential for high impact in the field. A Feature Paper should be a substantial original Article that involves several techniques or approaches, provides an outlook for future research directions and describes possible research applications.
Feature papers are submitted upon individual invitation or recommendation by the scientific editors and must receive positive feedback from the reviewers.
Editor’s Choice articles are based on recommendations by the scientific editors of MDPI journals from around the world. Editors select a small number of articles recently published in the journal that they believe will be particularly interesting to readers, or important in the respective research area. The aim is to provide a snapshot of some of the most exciting work published in the various research areas of the journal.
Original Submission Date Received: .
- Active Journals
- Find a Journal
- Proceedings Series
- For Authors
- For Reviewers
- For Editors
- For Librarians
- For Publishers
- For Societies
- For Conference Organizers
- Open Access Policy
- Institutional Open Access Program
- Special Issues Guidelines
- Editorial Process
- Research and Publication Ethics
- Article Processing Charges
- Testimonials
- Preprints.org
- SciProfiles
- Encyclopedia
Article Menu

- Subscribe SciFeed
- Recommended Articles
- Google Scholar
- on Google Scholar
- Table of Contents
Find support for a specific problem in the support section of our website.
Please let us know what you think of our products and services.
Visit our dedicated information section to learn more about MDPI.
JSmol Viewer
Evolving high-performance computing data centers with kubernetes, performance analysis, and dynamic workload placement based on machine learning scheduling.

1. Introduction
2. technology overview, 2.1. virtualization, 2.2. containerization technology.
- Efficient resource usage: Containers share the host system’s kernel, eliminating the need for a complete operating system for each instance. This results in lower overhead than virtual machines (VMs), each requiring their own OS, leading to more efficient CPU and memory use. The container’s average performance is generally better than that of the VM and is comparable to that of the physical machine in terms of many features [ 4 ].
- Faster startup time: Containers can start almost instantly because they do not require booting an entire operating system. In contrast, VMs take significantly longer to start as they need to initialize a whole OS, and the startup time difference from server power-on can be up to 50% [ 23 ]. This speed advantage makes containers ideal for applications that require quick scaling and deployment.
- Density: Due to their lightweight nature, a single host can run many more containers than VMs. For certain types of workloads, an application container’s startup time is 16× lower than that of a VM, and its memory footprint is 60× lower than that of a VM [ 24 ]. This higher density allows for better utilization of hardware resources, enabling more applications to run on the same infrastructure.
- Consistency: Containers encapsulate the application and its dependencies, ensuring consistent behavior across different environments. This consistency across development, testing, and production reduces bugs related to environmental differences.
- Better dependency management: Containers package all the necessary dependencies for an application, eliminating conflicts that arise when applications require different versions of the same dependencies. This encapsulation simplifies dependency management and ensures reliable application performance across various environments.
2.3. BSD Jails
2.4. docker, 2.6. podman, 2.7. kubernetes, 2.8. openshift vs. kubernetes.
- Parallel Computing: HPC systems rely on parallel computing, where multiple processors perform computations simultaneously. This includes fine-grained parallelism, where tasks are divided into smaller subtasks, and coarse-grained parallelism, where larger independent tasks run concurrently [ 52 ].
- Multi-Core and Many-Core Processors: These processors have multiple processing cores on a single chip and are connected with high-bandwidth communication links, including a QuickPath Interconnect (QPI) bus [ 53 ].
- Accelerators and Heterogeneous Computing: HPC systems use accelerators like GPUs, FPGAs, and specialized processing units to handle specific calculations more efficiently than general-purpose CPUs. Heterogeneous computing combines CPUs with accelerators, leveraging the strengths of different processing units to optimize performance [ 54 ].
- Distributed and Cluster Computing: HPC systems are often organized as clusters of interconnected computers (nodes), each with its own processors, memory, and storage. These clusters can scale to thousands of nodes, handling large datasets and complex simulations. Interconnects like InfiniBand and high-speed Ethernet enable fast node communication [ 57 ].
- Memory Hierarchy and Storage: Due to the large data volumes processed, efficient memory management is critical in HPC systems. HPC architectures use multi-level memory hierarchies, including cache, main memory, and high-speed storage solutions, to ensure quick data access and minimize latency [ 58 ]. This is why we need a good strategy to port and optimize existing applications to a massively parallel processor (MPP) system [ 59 ].
3. Virtualization vs. Containers
- Architecture: Virtualization employs a hypervisor to create and manage VMs, each with its own OS. In contrast, Podman runs containers on a shared OS kernel, which reduces overhead and boosts efficiency.
- Isolation: VMs achieve strong isolation by running separate OS instances. Podman containers provide process and filesystem isolation through namespaces and control groups, which, while less robust, are adequate for many applications.
- Resource Overhead: Virtualization demands more resources because an entire OS instance is needed per VM. Podman containers are lightweight, sharing the host OS kernel and minimizing resource usage.
- Performance: VMs generally have higher overhead and can be less efficient. Podman containers deliver better performance and faster startup times since they do not require a full OS boot.
- Deployment Speed: Deploying VMs takes longer due to OS initialization. Podman containers can be deployed rapidly, making them ideal for quick development and scaling.
- Resource Allocation: Resource allocation in virtualization is managed through the hypervisor and can be static or dynamic. Podman allows for flexible, real-time resource allocation for containers.
- Use Cases: Virtualization is well suited for running diverse OS environments, legacy applications, and high-security workloads. Podman excels in microservices, CI/CD pipelines, and modern application development.
- Security: VMs offer strong security with robust isolation, making them suitable for untrusted workloads. Podman containers are secure but rely on the host OS kernel, which can present vulnerabilities.
- Maintenance: Managing VMs involves handling multiple OS instances, leading to higher maintenance overhead. Podman containers simplify maintenance by sharing the host OS and dependencies.
- Compatibility: VMs can run different OS types and versions on a single host. Podman containers are limited to the host OS kernel but can quickly move across compatible environments.
4. Challenges Using Containers for HPC Workloads
- HPC application problem size and complexity: HPC apps have large datasets and complex calculations that a single processor cannot efficiently manage. Because of this, the problem is divided into many small tasks that can be processed concurrently using multiple processors or nodes [ 13 ].
- Speed and efficiency: Massively parallel design enables HPC apps to be quickly executed on HPC systems much faster than traditional computing methods. HPC applications can achieve significant speedups by utilizing hundreds, thousands, or more processors in parallel, solving problems much quicker than with a single processor [ 14 ].
- Scalability: HPC application scalability is essential to HPC application design, especially as datasets grow larger and more complex problems are found, necessitating more computation power. Different parallel algorithms are developed to improve performance as we scale to more processors [ 15 ].
- MPI (Message Passing Interface): Allows processors to communicate by sending and receiving MPI messages.
- OpenMP (Open Multi-Processing): This enables us to perform parallel application programming for shared memory architecture.
- CUDA (Compute Unified Device Architecture): Enables parallel processing on GPUs, often used for HPC because they are massively parallel hardware devices by design [ 24 ]. In GPU parallel programming and a CUDA framework, “kernels” and “threads” are foundational concepts for programming [ 63 ].
- HPC applications are usually deployed as standard applications, meaning they must be re-packaged into layers and container images if we want to run them in containers. This is a complex process and poses a real challenge. It is like the regular DevOps story of re-architecting a monolith application to be a microservices-based application, only much worse because HPC application libraries tend to be gigabytes and terabytes in size [ 14 ]. And that is even before we start discussing all potential security issues (image vulnerabilities, malware, clear text secrets, configuration issues, untrusted images, etc.) [ 64 ] or potential performance degradation [ 65 ].
- Even if we manage to package them into containers—which is not a given—we need to be able to run them on a scale, which means running them via Kubernetes. Again, this is not a small task, as understanding Kubernetes architecture, commands, intricacies, and the YAML files we need to create to run applications manually is also very complex.
5. Experimental Setup and Study Methodology
6. testing results.
- Default scheduler response time—The time required for the Kubernetes cluster to schedule a three-tier web app and for the front of that app to become available using the default Kubernetes scheduler. This is the correct testing methodology for that scenario, as it is only when the front end starts accepting client requests that we can say that the service is scheduled and operational.
- Custom scheduler response time—The time required for the Kubernetes cluster to schedule a three-tier web app and for the front end of that app to become available by using our Python-based custom scheduler.
- We could develop a custom scheduler per HPC application to place applications on Kubernetes pods. This would require a lot of time in terms of coding the Kubernetes schedulers, which might or might not work. Furthermore, there is no guarantee that this approach would work across multiple HPC data centers, making the idea less efficient and potentially wrong.
- We could develop something that acts as if a set of custom schedulers is present, without writing a set of custom schedulers, that could modify workload placement as it gathers information from the environment, learns about it, and then explicitly places workloads (or better yet, offers to place workloads) on a more suitable node or set of nodes. This is why we went with an ML-based idea that completely replaces the concept of writing multiple schedulers for multiple applications, as this process becomes unnecessary.
7. Proposed Platform Architecture for Kubernetes Integration with HPC
Click here to enlarge figure
7.1. Hardware Stack/Layer
7.2. software stack/layer, 7.3. machine learning layer, 7.4. user interface layer, 7.5. monitoring layer, 8. scheduling of hpc workloads on our platform via ml or manual placement, 8.1. manual workload placement, 8.2. ml-based workload placement.
- POWER usage—A set of timestamped power readings from the PDU socket and server remote management, sampled at configurable intervals. These readings estimate HPC application power requirements, significantly improving the platform’s energy efficiency, especially given time and many workload executions to become even more accurate.
- HEALTH information—A set of parameters taken from server remote management handling the health states of components, specifically fans, memory health state, power supply health state, power state (redundant or not), processor health state, storage health state, network, and remote management health state and temperatures.
- CPU, memory, storage, and networking testing results—As the server is provisioned from our platform in multiple passes, pre-determined synthetic and real-life benchmarks are automatically performed and averaged across the configurable number of runs. These bare-metal and containerized benchmarks determine the baseline hardware performance level for all servers added to the system. We use sysbench, stress-ng, hdparm, HPL, HPCC, and HPL with various parameters to gauge performance in single and multi-tasking scenarios.
- NVIDIA GPU results—A set of pre-determined synthetic and real-life benchmarks is automatically performed. The server with the installed NVIDIA GPU is provisioned from our platform in multiple takes, averaged across the configurable number of runs. We use NVIDIA HPC-Benchmarks for this purpose.
- FPGA/ASIC availability—For supported FPGA/ASIC controllers, platform users can manually add additional scores per app. Ideally, this would be automated, but it is currently impossible because of the different software stacks used by FPGAs and ASICs.
9. Future Work
10. conclusions, author contributions, data availability statement, conflicts of interest.
- Đorđević, B.; Kraljević, N.; Davidović, N. Performance Comparison of CPU Hardware-Assisted Features for the Type-2 Hypervisors. In Proceedings of the 2024 23rd International Symposium INFOTEH-JAHORINA (INFOTEH), Jahorina, Bosnia and Herzegovina, 20–22 March 2024. [ Google Scholar ] [ CrossRef ]
- Chen, Y.-R.; Liu, I.-H.; Chou, C.-W.; Li, J.-S.; Liu, C.-G. Multiple Virtual Machines Live Migration Scheduling Method Study on VMware vMotion. In Proceedings of the 2018 3rd International Conference on Computer and Communication Systems (ICCCS), Nagoya, Japan, 27–30 April 2018. [ Google Scholar ] [ CrossRef ]
- Shirinbab, S.; Lundberg, L.; Hakansson, J. Comparing Automatic Load Balancing Using VMware DRS with a Human Expert. In Proceedings of the 2016 IEEE International Conference on Cloud Engineering Workshop (IC2EW), Berlin, Germany, 4–8 April 2016. [ Google Scholar ] [ CrossRef ]
- Li, Z.; Kihl, M.; Lu, Q.; Andersson, J.A. Performance Overhead Comparison between Hypervisor and Container Based Virtualization. In Proceedings of the 2017 IEEE 31st International Conference on Advanced Information Networking and Applications (AINA), Taipei, Taiwan, 27–29 March 2017. [ Google Scholar ] [ CrossRef ]
- Wang, P.; Posey, S. GPU Best Practices for HPC Applications at Industry Scale. In GPU Solutions to Multi-Scale Problems in Science and Engineering ; Lecture Notes in Earth System Sciences; Springer: Berlin/Heidelberg, Germany, 2013; pp. 163–172. [ Google Scholar ] [ CrossRef ]
- Nonaka, J.; Ono, K.; Fujita, M. 234Compositor: A Flexible Parallel Image Compositing Framework for Massively Parallel Visualization Environments. Future Gener. Comput. Syst. 2018 , 82 , 647–655. [ Google Scholar ] [ CrossRef ]
- Vu, D.-D.; Tran, M.-N.; Kim, Y. Predictive Hybrid Autoscaling for Containerized Applications. IEEE Access 2022 , 10 , 109768–109778. [ Google Scholar ] [ CrossRef ]
- Milroy, D.J.; Misale, C.; Georgakoudis, G.; Elengikal, T.; Sarkar, A.; Drocco, M.; Patki, T.; Yeom, J.-S.; Gutierrez, C.E.A.; Ahn, D.H.; et al. One Step Closer to Converged Computing: Achieving Scalability with Cloud-Native HPC. In Proceedings of the 2022 IEEE/ACM 4th International Workshop on Containers and New Orchestration Paradigms for Isolated Environments in HPC (CANOPIE-HPC), Dallas, TX, USA, 14 November 2022; pp. 57–70. [ Google Scholar ] [ CrossRef ]
- Lublinsky, B.; Jennings, E.; Spišaková, V. A Kubernetes ‘Bridge’ Operator between Cloud and External Resources. In Proceedings of the 2023 8th International Conference on Cloud Computing and Big Data Analytics (ICCCBDA), Chengdu, China, 26–28 April 2023; pp. 263–269. [ Google Scholar ] [ CrossRef ]
- Spišaková, V.; Klusáček, D.; Hejtmánek, L. Using Kubernetes in Academic Environment: Problems and Approaches (Open Scheduling Problem). Available online: https://jsspp.org/papers22/6.pdf (accessed on 22 May 2024).
- Lingayat, A.; Badre, R.R.; Kumar Gupta, A. Performance Evaluation for Deploying Docker Containers on Baremetal and Virtual Machine. In Proceedings of the 2018 3rd International Conference on Communication and Electronics Systems (ICCES), Coimbatore, India, 15–16 October 2018. [ Google Scholar ] [ CrossRef ]
- Agarwal, K.; Jain, B.; Porter, D.E. Containing the Hype. In Proceedings of the 6th Asia-Pacific Workshop on Systems, Tokyo, Japan, 27–28 July 2015. [ Google Scholar ] [ CrossRef ]
- Antunes, C.; Vardasca, R. Performance of Jails versus Virtualization for Cloud Computing Solutions. Procedia Technol. 2014 , 16 , 649–658. [ Google Scholar ] [ CrossRef ]
- Trigo, A.; Varajão, J.; Sousa, L. DevOps Adoption: Insights from a Large European Telco. Cogent Eng. 2022 , 9 , 2083474. [ Google Scholar ] [ CrossRef ]
- Soltesz, S.; Pötzl, H.; Fiuczynski, M.E.; Bavier, A.; Peterson, L. Container-based operating system virtualization: A scalable, high-performance alternative to hypervisors. In Proceedings of the 2nd ACM SIGOPS/EuroSys European Conference on Computer Systems 2007, Lisbon, Portugal, 21–23 March 2007; Volume 41, pp. 275–287. [ Google Scholar ] [ CrossRef ]
- Li, X.; Jiang, J. Performance Analysis of PaaS Cloud Resources Management Model Based on LXC. In Proceedings of the 2016 International Conference on Cloud Computing and Internet of Things (CCIOT), Dalian, China, 22–23 October 2016; pp. 118–130. [ Google Scholar ] [ CrossRef ]
- Younge, A.J.; Pedretti, K.; Grant, R.E.; Brightwell, R. A Tale of Two Systems: Using Containers to Deploy HPC Applications on Supercomputers and Clouds. In Proceedings of the 2017 IEEE International Conference on Cloud Computing Technology and Science (CloudCom), Hong Kong, China, 11–14 December 2017; pp. 74–81. [ Google Scholar ] [ CrossRef ]
- Zhang, X.; Li, L.; Wang, Y.; Chen, E.; Shou, L. Zeus: Improving Resource Efficiency via Workload Colocation for Massive Kubernetes Clusters. IEEE Access 2021 , 9 , 105192–105204. [ Google Scholar ] [ CrossRef ]
- Felter, W.; Ferreira, A.; Rajamony, R.; Rubio, J. An Updated Performance Comparison of Virtual Machines and Linux Containers. In Proceedings of the 2015 IEEE International Symposium on Performance Analysis of Systems and Software (ISPASS), Philadelphia, PA, USA, 29–31 March 2015; pp. 171–172. [ Google Scholar ] [ CrossRef ]
- Burns, B.; Grant, B.; Oppenheimer, D.; Brewer, E.; Wilkes, J. Borg, Omega, and Kubernetes. Queue 2016 , 14 , 70–93. [ Google Scholar ] [ CrossRef ]
- Dordevic, B.; Timcenko, V.; Lazic, M.; Davidovic, N. Performance Comparison of Docker and Podman Container-Based Virtualization. In Proceedings of the 2022 21st International Symposium INFOTEH-JAHORINA (INFOTEH), East Sarajevo, Bosnia and Herzegovina, 16–18 March 2022. [ Google Scholar ] [ CrossRef ]
- Gantikow, H.; Walter, S.; Reich, C. Rootless Containers with Podman for HPC. In High Performance Computing, Proceedings of the International Conference on High Performance Computing, Frankfurt am Main, Germany, 22–25 June 2020 ; Lecture Notes in Computer Science; Springer: Berlin/Heidelberg, Germany, 21–25 June 2020; pp. 343–354. [ Google Scholar ] [ CrossRef ]
- Sheka, A.; Bersenev, A.; Samun, V. Containerization in Scientific Calculations. In Proceedings of the 2019 International Multi-Conference on Engineering, Computer and Information Sciences (SIBIRCON), Novosibirsk, Russia, 21–27 October 2019. [ Google Scholar ] [ CrossRef ]
- Kiourtis, A.; Karabetian, A.; Karamolegkos, P.; Poulakis, Y.; Mavrogiorgou, A.; Kyriazis, D. A Comparison of Container Systems for Machine Learning Scenarios: Docker and Podman. In Proceedings of the 2022 2nd International Conference on Computers and Automation (CompAuto), Paris, France, 18–20 August 2022. [ Google Scholar ] [ CrossRef ]
- Stephey, L.; Canon, S.; Gaur, A.; Fulton, D.; Younge, A.J. Scaling Podman on Perlmutter: Embracing a Community-Supported Container Ecosystem. In Proceedings of the 2022 IEEE/ACM 4th International Workshop on Containers and New Orchestration Paradigms for Isolated Environments in HPC (CANOPIE-HPC), Dallas, TX, USA, 4 November 2022. [ Google Scholar ] [ CrossRef ]
- Khaleq, A.A.; Ra, I. Intelligent Autoscaling of Microservices in the Cloud for Real-Time Applications. IEEE Access 2021 , 9 , 35464–35476. [ Google Scholar ] [ CrossRef ]
- Bernstein, D. Containers and Cloud: From LXC to Docker to Kubernetes. IEEE Cloud Comput. 2014 , 1 , 81–84. [ Google Scholar ] [ CrossRef ]
- Jagadeeswari, N.; Mohanraj, V.; Suresh, Y.; Senthilkumar, J. Optimization of Virtual Machines Performance Using Fuzzy Hashing and Genetic Algorithm-Based Memory Deduplication of Static Pages. Automatika 2023 , 64 , 868–877. [ Google Scholar ] [ CrossRef ]
- Lee, G. High-Performance Computing Networks. In Cloud Networking ; Elsevier B.V.: Amsterdam, The Netherlands, 2014; pp. 179–189. [ Google Scholar ] [ CrossRef ]
- Yang, H.; Ong, S.K.; Nee, A.Y.C.; Jiang, G.; Mei, X. Microservices-Based Cloud-Edge Collaborative Condition Monitoring Platform for Smart Manufacturing Systems. Int. J. Prod. Res. 2022 , 60 , 7492–7501. [ Google Scholar ] [ CrossRef ]
- Holmes, V.; Newall, M. HPC and the Big Data Challenge. Saf. Reliabil. 2016 , 36 , 213–224. [ Google Scholar ] [ CrossRef ]
- Houzeaux, G.; Garcia-Gasulla, M. High Performance Computing Techniques in CFD. Int. J. Comput. Fluid Dyn. 2020 , 34 , 457. [ Google Scholar ] [ CrossRef ]
- Örmecioğlu, T.O.; Aydoğdu, İ.; Örmecioğlu, H.T. GPU-Based Parallel Programming for FEM Analysis in the Optimization of Steel Frames. J. Asian Archit. Build. Eng. 2024 , 2024 , 2345310. [ Google Scholar ] [ CrossRef ]
- Jha, A.V.; Teri, R.; Verma, S.; Tarafder, S.; Bhowmik, W.; Kumar Mishra, S.; Appasani, B.; Srinivasulu, A.; Philibert, N. From Theory to Practice: Understanding DevOps Culture and Mindset. Cogent Eng. 2023 , 10 , 2251758. [ Google Scholar ] [ CrossRef ]
- Li, H.; Kettinger, W.J.; Yoo, S. Dark Clouds on the Horizon? Effects of Cloud Storage on Security Breaches. J. Manag. Inf. Syst. 2024 , 41 , 206–235. [ Google Scholar ] [ CrossRef ]
- Greneche, N.; Cerin, C. Autoscaling of Containerized HPC Clusters in the Cloud. In Proceedings of the 2022 IEEE/ACM International Workshop on Interoperability of Supercomputing and Cloud Technologies (SuperCompCloud), Dallas, TX, USA, 13–18 November 2022; pp. 1–7. [ Google Scholar ] [ CrossRef ]
- Liu, P.; Guitart, J. Fine-Grained Scheduling for Containerized HPC Workloads in Kubernetes Clusters. Available online: http://arxiv.org/abs/2211.11487 (accessed on 22 May 2024).
- Beltre, A.M.; Saha, P.; Govindaraju, M.; Younge, A.; Grant, R.E. Enabling HPC Workloads on Cloud Infrastructure Using Kubernetes Container Orchestration Mechanisms. In Proceedings of the 2019 IEEE/ACM International Workshop on Containers and New Orchestration Paradigms for Isolated Environments in HPC (CANOPIE-HPC), Denver, CO, USA, 18 November 2019; pp. 11–20. [ Google Scholar ] [ CrossRef ]
- Hursey, J. A Separated Model for Running Rootless, Unprivileged PMIx-Enabled HPC Applications in Kubernetes. In Proceedings of the 2022 IEEE/ACM 4th International Workshop on Containers and New Orchestration Paradigms for Isolated Environments in HPC (CANOPIE-HPC), Dallas, TX, USA, 14 November 2022. [ Google Scholar ]
- Jang, H.-C.; Luo, S.-Y. Enhancing Node Fault Tolerance through High-Availability Clusters in Kubernetes. In In Proceedings of the 2023 IEEE 3rd International Conference on Electronic Communications, Internet of Things and Big Data (ICEIB) 2023, Taichung, Taiwan, 14–15 April 2023. [ Google Scholar ] [ CrossRef ]
- Ding, Z.; Wang, S.; Jiang, C. Kubernetes-Oriented Microservice Placement with Dynamic Resource Allocation. IEEE Trans. Cloud Comput. 2023 , 11 , 1777–1793. [ Google Scholar ] [ CrossRef ]
- Hursey, J. Design Considerations for Building and Running Containerized MPI Applications. In Proceedings of the 2020 2nd International Workshop on Containers and New Orchestration Paradigms for Isolated Environments in HPC (CANOPIE-HPC), Atlanta, GA, USA, 12 November 2020. [ Google Scholar ] [ CrossRef ]
- Sukhija, N.; Bautista, E. Towards a Framework for Monitoring and Analyzing High Performance Computing Environments Using Kubernetes and Prometheus. In Proceedings of the 2019 IEEE SmartWorld, Ubiquitous Intelligence & Computing, Advanced & Trusted Computing, Scalable Computing & Communications, Cloud & Big Data Computing, Internet of People and Smart City Innovation (SmartWorld/SCALCOM/UIC/ATC/CBDCom/IOP/SCI), Leicester, UK, 19–23 August 2019; pp. 257–262. [ Google Scholar ] [ CrossRef ]
- Kosinska, J.; Tobiasz, M. Detection of Cluster Anomalies with ML Techniques. IEEE Access 2022 , 10 , 110742–110753. [ Google Scholar ] [ CrossRef ]
- Sebrechts, M.; Borny, S.; Wauters, T.; Volckaert, B.; De Turck, F. Service Relationship Orchestration: Lessons Learned from Running Large Scale Smart City Platforms on Kubernetes. IEEE Access 2021 , 9 , 133387–133401. [ Google Scholar ] [ CrossRef ]
- Vasireddy, I.; Ramya, G.; Kandi, P. Kubernetes and Docker Load Balancing: State-of-the-Art Techniques and Challenges. Int. J. Innov. Res. Eng. Manag. 2023 , 10 , 49–54. [ Google Scholar ] [ CrossRef ]
- Vohra, D. Installing Kubernetes Using Docker. In Kubernetes Microservices with Docker ; Springer: Berlin/Heidelberg, Germany, 2016; pp. 3–38. [ Google Scholar ] [ CrossRef ]
- Liu, B.; Li, J.; Lin, W.; Bai, W.; Li, P.; Gao, Q. K-PSO: An Improved PSO-based Container Scheduling Algorithm for Big Data Applications. Int. J. Netw. Manag. 2020 , 31 , e2092. [ Google Scholar ] [ CrossRef ]
- Malviya, A.; Dwivedi, R.K. A Comparative Analysis of Container Orchestration Tools in Cloud Computing. In Proceedings of the 2022 9th International Conference on Computing for Sustainable Global Development (INDIACom) 2022, New Delhi, India, 24–25 March 2022. [ Google Scholar ] [ CrossRef ]
- Pan, Y.; Chen, I.; Brasileiro, F.; Jayaputera, G.; Sinnott, R. A Performance Comparison of Cloud-Based Container Orchestration Tools. In Proceedings of the 2019 IEEE International Conference on Big Knowledge (ICBK), Beijing, China, 10–11 November 2019. [ Google Scholar ] [ CrossRef ]
- Lee, S.; Raza Shah, S.A.; Seok, W.; Moon, J.; Kim, K.; Raza Shah, S.H. An Optimal Network-Aware Scheduling Technique for Distributed Deep Learning in Distributed HPC Platforms. Electronics 2023 , 12 , 3021. [ Google Scholar ] [ CrossRef ]
- Zha, B.; Shen, H. Adaptively Periodic I/O Scheduling for Concurrent HPC Applications. Electronics 2022 , 11 , 1318. [ Google Scholar ] [ CrossRef ]
- Granhão, D.; Canas Ferreira, J. Transparent Control Flow Transfer between CPU and Accelerators for HPC. Electronics 2021 , 10 , 406. [ Google Scholar ] [ CrossRef ]
- Ruhela, A.; Xu, S.; Manian, K.V.; Subramoni, H.; Panda, D.K. Analyzing and Understanding the Impact of Interconnect Performance on HPC, Big Data, and Deep Learning Applications: A Case Study with InfiniBand EDR and HDR. In Proceedings of the 2020 IEEE International Parallel and Distributed Processing Symposium Workshops (IPDPSW) 2020, New Orleans, LA, USA, 18–22 May 2020. [ Google Scholar ] [ CrossRef ]
- Aly, M.; Khomh, F.; Yacout, S. Kubernetes or OpenShift? Which Technology Best Suits Eclipse Hono IoT Deployments. In Proceedings of the 2018 IEEE 11th Conference on Service-Oriented Computing and Applications (SOCA), Paris, France, 20–22 November 2018. [ Google Scholar ] [ CrossRef ]
- Linzel, B.; Zhu, E.; Flores, G.; Liu, J.; Dikaleh, S. How can OpenShift accelerate your Kubernetes adoption: A workshop exploring OpenShift features. In Proceedings of the CASCON’19: Proceedings of the 29th Annual International Conference on Computer Science and Software Engineering, Markham, ON, Canada, 4–6 November 2019; pp. 380–381. [ Google Scholar ] [ CrossRef ]
- Vohra, D. Using an HA Master with OpenShift. In Kubernetes Management Design Patterns ; Apress: New York, NY, USA, 2017; pp. 335–353. [ Google Scholar ] [ CrossRef ]
- Marksteiner, P. High-Performance Computing—An Overview. Comput. Physics Commun. 1996 , 97 , 16–35. [ Google Scholar ] [ CrossRef ]
- Cardoso, J.M.P.; Coutinho, J.G.F.; Diniz, P.C. High-Performance Embedded Computing. In Proceedings of the Embedded Computing for High Performance, Waltham, MA, USA, 12–14 September 2017; pp. 17–56. [ Google Scholar ] [ CrossRef ]
- Feng, W.; Manocha, D. High-Performance Computing Using Accelerators. Parallel Comput. 2007 , 33 , 645–647. [ Google Scholar ] [ CrossRef ]
- Kindratenko, V.; Thiruvathukal, G.K.; Gottlieb, S. High-Performance Computing Applications on Novel Architectures. Comput. Sci. Eng. 2008 , 10 , 13–15. [ Google Scholar ] [ CrossRef ]
- Lee, V.W.; Grochowski, E.; Geva, R. Performance Benefits of Heterogeneous Computing in HPC Workloads. In Proceedings of the 2012 IEEE 26th International Parallel and Distributed Processing Symposium Workshops & PhD Forum 2012, Shanghai, China, 21–25 May 2012. [ Google Scholar ] [ CrossRef ]
- Ambrosino, G.; Fioccola, G.B.; Canonico, R.; Ventre, G. Container Mapping and Its Impact on Performance in Containerized Cloud Environments. In Proceedings of the 2020 IEEE International Conference on Service Oriented Systems Engineering (SOSE), Oxford, UK, 3–6 August 2020. [ Google Scholar ] [ CrossRef ]
- Senjab, K.; Abbas, S.; Ahmed, N.; Khan, A.U.R. A Survey of Kubernetes Scheduling Algorithms. J. Cloud Comput. 2023 , 12 , 87. [ Google Scholar ] [ CrossRef ]
- Carrión, C. Kubernetes Scheduling: Taxonomy, Ongoing Issues and Challenges. ACM Comput. Surv. 2022 , 55 , 1–37. [ Google Scholar ] [ CrossRef ]
- Rodriguez, G.; Yannibelli, V.; Rocha, F.G.; Barbara, D.; Azevedo, I.M.; Menezes, P.M. Understanding and Addressing the Allocation of Microservices into Containers: A Review. IETE J. Res. 2023 , 1–14. [ Google Scholar ] [ CrossRef ]
- Gomez, C.; Martinez, F.; Armejach, A.; Moreto, M.; Mantovani, F.; Casas, M. Design Space Exploration of Next-Generation HPC Machines. In Proceedings of the 2019 IEEE International Parallel and Distributed Processing Symposium (IPDPS), Rio de Janeiro, Brazil, 20–24 May 2019. [ Google Scholar ] [ CrossRef ]
- Tesliuk, A.; Bobkov, S.; Ilyin, V.; Novikov, A.; Poyda, A.; Velikhov, V. Kubernetes Container Orchestration as a Framework for Flexible and Effective Scientific Data Analysis. In Proceedings of the 2019 Ivannikov Ispras Open Conference (ISPRAS), Moscow, Russia, 5–6 December 2019; pp. 67–71. [ Google Scholar ] [ CrossRef ]
- Rathmayer, S.; Lenke, M. A Tool for On-Line Visualization and Interactive Steering of Parallel HPC Applications. In Proceedings of the 11th International Parallel Processing Symposium, Geneva, Switzerland, 1–5 April 1997. [ Google Scholar ] [ CrossRef ]
- Ruiz, L.M.; Pueyo, P.P.; Mateo-Fornes, J.; Mayoral, J.V.; Tehas, F.S. Autoscaling Pods on an On-Premise Kubernetes Infrastructure QoS-Aware. IEEE Access 2022 , 10 , 33083–33094. [ Google Scholar ] [ CrossRef ]
- Lossent, A.; Rodriguez Peon, A.; Wagner, A. PaaS for Web Applications with OpenShift Origin. J. Phys. Conf. Ser. 2017 , 898 , 082037. [ Google Scholar ] [ CrossRef ]
- Levesque, J.; Wagenbreth, G. High Performance Computing ; Chapman and Hall/CRC: Boca Raton, FL, USA, 2010. [ Google Scholar ] [ CrossRef ]
- Souppaya, M.; Morello, J.; Scarfone, K. Application Container Security Guide ; National Institute of Standards and Technology: Gaithersburg, MD, USA, 2017. [ Google Scholar ] [ CrossRef ]
- Flora, J.; Goncalves, P.; Teixeira, M.; Antunes, N. A Study on the Aging and Fault Tolerance of Microservices in Kubernetes. IEEE Access 2022 , 10 , 132786–132799. [ Google Scholar ] [ CrossRef ]
- Zhou, N.; Georgiou, Y.; Zhong, L.; Zhou, H.; Pospieszny, M. Container Orchestration on HPC Systems. In Proceedings of the 2020 IEEE 13th International Conference on Cloud Computing (CLOUD), Virtual Event, 18–24 October 2020; pp. 34–36. [ Google Scholar ] [ CrossRef ]
- Roslin Dayana, K.; Shobha Rani, P. Secure Cloud Data Storage Solution with Better Data Accessibility and Time Efficiency. Automatika 2023 , 64 , 756–763. [ Google Scholar ] [ CrossRef ]
- Grigoryan, G.; Kwon, M.; Rafique, M.M. Extending the Control Plane of Container Orchestrators for I/O Virtualization. In Proceedings of the 2020 2nd International Workshop on Containers and New Orchestration Paradigms for Isolated Environments in HPC (CANOPIE-HPC), Atlanta, GA, USA, 12 November 2020. [ Google Scholar ] [ CrossRef ]
- Smith, M.C.; Drager, S.L.; Pochet, L.; Peterson, G.D. High Performance Reconfigurable Computing Systems. In Proceedings of the 44th IEEE 2001 Midwest Symposium on Circuits and Systems. MWSCAS 2001 (Cat. No.01CH37257), Dayton, OH, USA, 14–17 August 2001. [ Google Scholar ] [ CrossRef ]
| Test Scenario | Estimated Neural Network Response Time | Custom Scheduler Response Time | Mean Response Time Error | Default Scheduler Response Time |
|---|---|---|---|---|
| No workloads placed | 6.45 | 5.89 | 0.56 | 5.94 |
| One node is used for workloads | 6.4 | 6.09 | 0.31 | 6.15 |
| Two nodes are used for workloads | 6.53 | 6.4 | 0.13 | 6.95 |
| Three nodes are used for workloads | 6.6 | 6.69 | 0.09 | 7.88 |
| Four nodes are used for workloads | 7.58 | 10.76 | 3.18 | 12.72 |
| Test Scenario | Estimated Neural Network Response Time | Custom Scheduler Response Time | Mean Response Time Error | Default Scheduler Response Time |
|---|---|---|---|---|
| No workloads placed | 9.32 | 9.08 | 0.24 | 9.28 |
| One node is used for workloads | 10.13 | 9.76 | 0.37 | 10.03 |
| Two nodes are used for workloads | 12.41 | 11.78 | 0.63 | 12.13 |
| Three nodes are used for workloads | 13.78 | 13.37 | 0.41 | 13.59 |
| Four nodes are used for workloads | 14.96 | 14.41 | 0.55 | 14.88 |
| The statements, opinions and data contained in all publications are solely those of the individual author(s) and contributor(s) and not of MDPI and/or the editor(s). MDPI and/or the editor(s) disclaim responsibility for any injury to people or property resulting from any ideas, methods, instructions or products referred to in the content. |
Share and Cite
Dakić, V.; Kovač, M.; Slovinac, J. Evolving High-Performance Computing Data Centers with Kubernetes, Performance Analysis, and Dynamic Workload Placement Based on Machine Learning Scheduling. Electronics 2024 , 13 , 2651. https://doi.org/10.3390/electronics13132651
Dakić V, Kovač M, Slovinac J. Evolving High-Performance Computing Data Centers with Kubernetes, Performance Analysis, and Dynamic Workload Placement Based on Machine Learning Scheduling. Electronics . 2024; 13(13):2651. https://doi.org/10.3390/electronics13132651
Dakić, Vedran, Mario Kovač, and Jurica Slovinac. 2024. "Evolving High-Performance Computing Data Centers with Kubernetes, Performance Analysis, and Dynamic Workload Placement Based on Machine Learning Scheduling" Electronics 13, no. 13: 2651. https://doi.org/10.3390/electronics13132651
Article Metrics
Article access statistics, further information, mdpi initiatives, follow mdpi.
Subscribe to receive issue release notifications and newsletters from MDPI journals
Numbers, Facts and Trends Shaping Your World
Read our research on:
Full Topic List
Regions & Countries
- Publications
- Our Methods
- Short Reads
- Tools & Resources
Read Our Research On:
Political Typology Quiz
Where do you fit in the political typology, are you a faith and flag conservative progressive left or somewhere in between.

Take our quiz to find out which one of our nine political typology groups is your best match, compared with a nationally representative survey of more than 10,000 U.S. adults by Pew Research Center. You may find some of these questions are difficult to answer. That’s OK. In those cases, pick the answer that comes closest to your view, even if it isn’t exactly right.
Sign up for The Briefing
Weekly updates on the world of news & information
1615 L St. NW, Suite 800 Washington, DC 20036 USA (+1) 202-419-4300 | Main (+1) 202-857-8562 | Fax (+1) 202-419-4372 | Media Inquiries
Research Topics
- Email Newsletters
ABOUT PEW RESEARCH CENTER Pew Research Center is a nonpartisan fact tank that informs the public about the issues, attitudes and trends shaping the world. It conducts public opinion polling, demographic research, media content analysis and other empirical social science research. Pew Research Center does not take policy positions. It is a subsidiary of The Pew Charitable Trusts .
© 2024 Pew Research Center
- Advanced search
Advanced Search
Neural Representations of Sensory Uncertainty and Confidence are Associated with Perceptual Curiosity
- Find this author on Google Scholar
- Find this author on PubMed
- Search for this author on this site
- Info & Metrics
Humans are immensely curious and motivated to reduce uncertainty, but little is known about the neural mechanisms that generate curiosity. Curiosity is inversely associated with confidence, suggesting that it is triggered by states of low confidence (subjective uncertainty). The neural mechanisms of this process, however, have been little investigated. What are the mechanisms through which uncertainty about an event gives rise to curiosity about that event? Inspired by studies of sensory uncertainty, we hypothesized that visual areas provide multivariate representations of uncertainty, which are then read out by higher-order structures to generate signals of confidence and, ultimately, trigger curiosity. During fMRI, participants (17 female, 15 male) performed a new task in which they rated their confidence in identifying distorted images of animals and objects and their curiosity to see the clear image. To link sensory certainty and curiosity, we measured the activity evoked by each image in occipitotemporal cortex (OTC) and devised a new metric of “OTC Certainty” indicating the strength of evidence this activity conveys about the animal vs. object categories. We show that, consistent with findings using trivia questions, perceptual curiosity peaked at low confidence. Moreover, OTC Certainty negatively correlated with curiosity, establishing a link between curiosity and a multivariate representation of sensory uncertainty. Finally, univariate (average) activity in two frontal areas – vmPFC and ACC – correlated positively with confidence and negatively with curiosity, and the vmPFC mediated the relationship between OTC Certainty and curiosity. The results suggest that multiple mechanisms link curiosity with representations of confidence and uncertainty.
Significance Statement Curiosity motivates us to explore and learn about the world around us. Traditional perspectives hypothesize that curiosity arises from variability in confidence, but the neural mechanisms by which this occurs have been difficult to evaluate. Here, we harness the human visual system to uncover a neural mechanism of curiosity. We show that a multivariate representation of certainty in occitotemporal cortex is transformed into a univariate representation of confidence in prefrontal cortex to facilitate curiosity. Together, these results illuminate how perceptual input is transformed by successive neural representations to ultimately evoke a feeling of curiosity - elucidating how and why we become curious to learn and delve into diverse domains of knowledge.
The research described in this paper was supported by the National Institute of Mental Health as part of the National Research Service Award (Grant #:1F31MH125589), and the Zuckerman Institute MR Seed Grant Award (Grant #: CU-ZI-MR-S-0017) both awarded to Michael Cohanpour. We thank the Alyssano Group, Gottlieb Lab, Kriegeskorte Lab, Christopher Baldassano, Janet Metcalfe, and Yasmine El-Shamayleh for their valuable insight on this project; Ray Lee and Noreen Violante for their technical support with the MRI scanner; and Serra Favila, Heiko Schütt, and Javier Domínguez Zamora for their crucial revisions to the manuscript.
The authors declare that they have no conflict of interest.
↵ * equal contribution
SfN exclusive license .
Member Log In
Log in using your username and password, purchase access.
Thank you for sharing this Journal of Neuroscience article.
NOTE: We request your email address only to inform the recipient that it was you who recommended this article, and that it is not junk mail. We do not retain these email addresses.
Citation Manager Formats
- EndNote (tagged)
- EndNote 8 (xml)
- RefWorks Tagged
- Ref Manager

- Tweet Widget
- Facebook Like
- Google Plus One
Jump to section
Responses to this article, jump to comment:, related articles, cited by..., more in this toc section, research articles.
- Electrical synapses mediate embryonic hyperactivity in a zebrafish model of Fragile X syndrome
- Dopamine Release in the Nucleus Accumbens Core Encodes the General Excitatory Components of Learning
Behavioral/Cognitive
- The Network Structure of Cognitive Impairment: From Subjective Cognitive Decline to Alzheimer's Disease
IMAGES
VIDEO
COMMENTS
Your results should always be written in the past tense. While the length of this section depends on how much data you collected and analyzed, it should be written as concisely as possible. Only include results that are directly relevant to answering your research questions. Avoid speculative or interpretative words like "appears" or ...
Research results refer to the findings and conclusions derived from a systematic investigation or study conducted to answer a specific question or hypothesis. These results are typically presented in a written report or paper and can include various forms of data such as numerical data, qualitative data, statistics, charts, graphs, and visual aids.
The results section of a research paper tells the reader what you found, while the discussion section tells the reader what your findings mean. The results section should present the facts in an academic and unbiased manner, avoiding any attempt at analyzing or interpreting the data. Think of the results section as setting the stage for the ...
Practical guidance for writing an effective results section for a research paper. Always use simple and clear language. Avoid the use of uncertain or out-of-focus expressions. The findings of the study must be expressed in an objective and unbiased manner. While it is acceptable to correlate certain findings in the discussion section, it is ...
Reporting Research Results in APA Style | Tips & Examples. Published on December 21, 2020 by Pritha Bhandari.Revised on January 17, 2024. The results section of a quantitative research paper is where you summarize your data and report the findings of any relevant statistical analyses.. The APA manual provides rigorous guidelines for what to report in quantitative research papers in the fields ...
Step 1: Consult the guidelines or instructions that the target journal or publisher provides authors and read research papers it has published, especially those with similar topics, methods, or results to your study. The guidelines will generally outline specific requirements for the results or findings section, and the published articles will ...
When writing the results section, avoid doing the following: Discussing or interpreting your results. Save this for the discussion section of your paper, although where appropriate, you should compare or contrast specific results to those found in other studies [e.g., "Similar to the work of Smith [1990], one of the findings of this study is ...
Chris A. Mack. SPIE. 2018. Present the results of the paper, in logical order, using tables and graphs as necessary. Explain the results and show how they help to answer the research questions posed in the Introduction. Evidence does not explain itself; the results must be presented and then explained. Avoid: presenting results that are never ...
Psychology papers generally follow a specific structure. One important section of a paper is known as the results section. An APA results section of a psychology paper summarizes the data that was collected and the statistical analyses that were performed. The goal of this section is to report the results of your study or experiment without any ...
Build coherence along this section using goal statements and explicit reasoning (guide the reader through your reasoning, including sentences of this type: 'In order to…, we performed….'; 'In view of this result, we ….', etc.). In summary, the general steps for writing the Results section of a research article are:
1. Context. The "results section" is the heart of the paper, around which the other sections are organized ().Research is about results and the reader comes to the paper to discover the results ().In this section, authors contribute to the development of scientific literature by providing novel, hitherto unknown knowledge ().In addition to the results, this section contains data and ...
The Results section is a vital organ of a scientific paper, the main reason why readers come and read to. " ". nd new information in the paper. However, writing the"Results section demands a rigorous process that discourages. fi ". many researchers, leaving their work unpublished and uncommunicated in reputable journals.
The writing of the results section of a scientific paper is very important for the readers for clearly understanding of the study. This review summarizes the rules for writing the results section of a scientific paper and describes the use of tables and figures. ... As an example elucidating the abovementioned topics a research paper written by ...
Developing a well-written research paper is an important step in completing a scientific study. This paper is where the principle investigator and co-authors report the purpose, methods, findings, and conclusions of the study. A key element of writing a research paper is to clearly and objectively report the study's findings in the Results section.
III. Problems to Avoid. When writing the results section, avoid doing the following:. Discussing or interpreting your results.Save all this for the next section of your paper, although where appropriate, you should compare or contrast specific results to those found in other studies [e.g., "Similar to Smith [1990], one of the findings of this study is the strong correlation between motivation ...
The "Results" section is arguably the most important section in a research manuscript as the findings of a study, obtained diligently and painstakingly, are presented in this section. A well-written results section reflects a well-conducted study. This chapter provides helpful pointers for writing an effective, organized results section.
The "Results section" is the third most important anatomical structure of IMRAD (Introduction, Method and Material, Result, And Discussion) frameworks, the almost universally accepted framework in many journals in the late nineteenth century. 3 Before using a structured IMRAD format, research findings in scientific papers were presented in ...
The APA results section summarizes data and includes reporting statistics in a quantitative research study. The APA results section is an essential part of your research paper and typically begins with a brief overview of the data followed by a systematic and detailed reporting of each hypothesis tested. The interpreted results will then be presented in the discussion sections.
A results section is the third component of a research paper that follows the introduction and methodology sections. This third component provides researchers with the opportunity to objectively ...
The results section should simply be hard facts written in the passive voice. Many students get confused between the active and passive voices when writing a research paper. Unlike the rest of the paper, the results section should be written in the passive voice in order to draw attention to the action and not to the person performing the action.
The results section of a research paper refers to the part that represents the study's core findings from the methods that the researcher used to collect and analyze data. This section presents the results logically without interpretation or bias from the author. Thus, this part of a research paper sets up the read for evaluation and analysis ...
The results are considered the core section of a research paper and should include only factual statements that convey the information gathered from your study, even if it does not prove your original theories. Variables can be addressed if they had a noticeable positive or negative effect on outcomes. And all statistics that are included ...
Writing a Research Results section that do not address the negative results, invalidates the research paper and does not reflect appropriate academic writing. Research Results Comparison with Similar Academic Articles. The largest part of interpreting and discussing your research findings should be reserved for the Discussion / Conclusion section.
Here are some key steps on how to write an abstract in research papers: [9] Write the abstract after you've finished writing your paper. Select the major objectives/hypotheses and conclusions from your Introduction and Conclusion sections. Select key sentences from your Methods section. Identify the major results from the Results section.
In conclusion, writing an effective background for the study is crucial for setting the stage for your research paper. By following these three tips—establishing the context, identifying the research gap, and justifying the significance of your study—you can craft a compelling background section that clearly articulates the importance and ...
Grammar Checker to make sure your grammar, spelling, and punctuation are correct; Paraphraser to understand ideas you read in your research and improve the fluency of your writing; Summarizer to compose a potential thesis statement and concluding sentences for paragraphs and sections; QuillBot Flow to work on your research paper from start to finish; Writing a research paper requires a lot of ...
A Feature Paper should be a substantial original Article that involves several techniques or approaches, provides an outlook for future research directions and describes possible research applications. Feature papers are submitted upon individual invitation or recommendation by the scientific editors and must receive positive feedback from the ...
ABOUT PEW RESEARCH CENTER Pew Research Center is a nonpartisan fact tank that informs the public about the issues, attitudes and trends shaping the world. It conducts public opinion polling, demographic research, media content analysis and other empirical social science research. Pew Research Center does not take policy positions.
The results suggest that multiple mechanisms link curiosity with representations of confidence and uncertainty. Significance Statement Curiosity motivates us to explore and learn about the world around us. ... The research described in this paper was supported by the National Institute of Mental Health as part of the National Research Service ...