
Common Cause & Special Cause Variation Explained with Examples
Editorial Team

In any business operation, it is important to ensure consistency in products as well as repeatable results. Managers and workers alike have to be aware of the processes and methods on how to produce consistent outcomes at all costs. However, we cannot deny that producing exactly identical products or results is almost impossible as variance tends to exist. Variation is not necessarily a bad thing as long as it is within the standard of the critical to qualities (CTQs) specification limits.
Process variation is the occurrence when a system deviates from its fixed pattern and produces a result which differs from the usual ones. This is a major key as it concerns the consistencies of the transactional as well as the manufacturing of the business systems. Variation should be evaluated as it portrays the reliability of the business for the customers and stakeholders. Variation may also cost money hence it is crucial to keep variation at bay to prevent too much cost spent on variation. It is crucial to be able to distinguish the types of variance that occur in your business process since it will give the lead on what course of action to take. Mistakes in coming up with an effective reaction plan towards the variance may worsen the processes of the business.
There are two types of process variation which will be further elaborated in this article. The variations are known as common cause variation and special cause variation.
Common Cause Variation Definition
Common cause variation refers to the natural and measurable anomalies that occur in the system or business processes. It naturally exists within the system. While it is true that variance may bring a negative impact to business operations, we cannot escape from this aspect. It is inherent and will always be. In most cases, the common cause variant is constant, regular, and could be predicted within the business operations. The other term used to describe this variation is Natural Problems, Noise, or Random Cause. Common cause variance could be presented and analysed using histogram.
What is Common Cause Variation
There are several distinguishable characteristics of common cause variation. Firstly, the variation pattern is predictable. Common cause variation occurring is also an active event in the operations. it is controlled and is not significantly different from the usual phenomenon.
There are many factors and reasons for common cause variation and it is quite difficult to pinpoint and eliminate them. Some common cause variations are accepted within the business process and operations as long as they are within a tolerable level. Eradicating them is an arduous effort unless a drastic measure is implemented towards the operation.
Common Cause Variation Examples
There is a wide range of examples for common cause variation. Let’s take driving as an example. Usually, a driver is well aware of their destinations and the conditions of the path to reach the destination. Since they have been regularly using the same road, any defects or problems such as bumps, conditions of the road, and usual traffic are normal. They may not be able to precisely arrive at the destination at the same duration every time due to these common causes. However, the duration to arrive at the destination may not be largely differing day to day.
In terms of project-related variations, some of the examples include technical issues, human errors, downtime, high trafficking, poor computer response times, mistakes in standard procedures, and many more. Some other examples of common causes include poor design of products, outdated systems, and poor maintenance. Inconducive working conditions may also result in to common cause variants which could comprise of ventilation, temperature, humidity, noise, lighting, dirt, and so forth. Errors such as quality control and measurement could also be counted as common cause variation.
Special Cause Variation Definition
On the other hand, special cause variation refers to the unforeseen anomalies or variance that occurs within business operations. This variation, as the name suggests, is special in terms of being rare, having non-quantifiable patterns, and may not have been observed before. It is also known as Assignable Cause. Other opinions also mentioned that special cause variation is not only variance that happens for the first time, a previously overlooked or ignored problem could also be considered a special cause variation.
What is Special Cause Variation
Special cause variation is irregular occurrences and usually happens due to changes that were brought about in the business operations. It is not your mundane defects and may be very unpredictable. Most of the time, special cause variation happens following the flaws within the business processes or mechanism. While it may sound serious and taxing, there are ways to fix this which is by modifying the affected procedures or materials.
One of the characteristics of special cause variation is that it is uncontrolled and hardly predictable. The outcome of special causes variation is significantly different from the usual phenomenon. Since the issues are not predictable, it is usually problematic and may not even be recorded in the historical experience base.
Special Cause Variation Examples
As mentioned earlier, special cause variations are unexpected variants that occur due to factors that may affect the business system or operations. Let’s have an example of a special cause using the same scenario as previously elaborated for common cause variation example. The mentioned defects were common. Now, imagine if there is an unexpected accident that happens on the same road you usually take. Due to this accident, the time for the driver to arrive at the same destination may take longer than normal. Hence this accident is considered as a special cause variation. It is unexpected and results in a significantly different outcome, in this case, a longer time to arrive at the destination.
The example of special cause variation in the manufacturing sector includes environment, materials, manpower, technology, equipment, and many more. In terms of manpower, imagine a new employee is recruited into the team and still lacking in experience. The coaching and instructions should be adapted to consider that the person needs more training to be able to perform their tasks efficiently. Cases where a new supplier is needed in a short amount of time due to issues faced by the existing supplier are also unforeseen hence considered a special cause variation. Natural hazards that are beyond predictions may also be categorized into special cause variation. Some other examples include irregular traffic or fraud attack. An unexpected computer crash or malfunction in some of the components may also be considered as a special cause variation.
Common Cause and Special Cause Variation Detection
Control chart
One of the ways to keep track of common cause and special cause variation is by implementing control charts. When using control charts, the important aspect to be considered is firstly, establishing the average point of measurement. Next, establish the control limits. Usually, there are three standard deviations which are marked above and below the average point earlier. The last step is by determining which points exceed the upper and lower control limits established earlier. The points beyond the limits are special cause variation.
Before we get into the control chart of common cause and special cause variation, let’s have a look at the eight control chart rules first. If a process is stable, the points displayed in the chart will be near the average point and will not exceed the control limits.
However, it should be noted that not all rules are applicable to all types of control charts. That aside, it is quite tough to identify the causes of the patterns since special cause variation may be related to the specific type of processes. The table presented is the general rule that could be applied in most cases but is also subject to changes or differences. Studying the chart should be accompanied by knowledge and experiences in order to pinpoint the reasons for the patterns or variations.
A process is considered stable if special cause variation is not present, even if a common cause exists. A stable operation is important before it could be assessed or being improved. We could look at the stability or instability of the processes as displayed in control charts or run charts .

The points displayed in the chart above are randomly distributed and do not defy any of the eight rules listed earlier. This indicates that the process is stable.

The chart presented above is an example of an unstable process. This is because some of the rules for control chart tests mentioned earlier are violated.
Simply, if the points are randomly distributed and are within the limit, they may be considered as the common cause variation. However, if there is a drastic irregularity or points exceeding the limit, you may want to analyse more into it to determine if it is a special cause variation.
Histogram is a type of bar graph that could be used to present the distribution of occurrences of data. It is easily understandable and analysed. A histogram provides information on the history of the processes done as well as forecasting the future performance of the operations. To ensure the reliability of the data presented in the histogram, it is essential for the process to be stable. As mentioned earlier, although affected by common cause variation, the processes are still considered stable, hence histogram may be used on this occasion, especially if the processes undergo regular measurement and assessment.
The data is considered to be normally distributed if it portrays a “bell” shape in the histogram. The data are grouped around the central value and this cluster is known as variation. There are several other examples of more complicated patterns, such as having several peaks in the histogram or a shortened histogram. Whenever these examples of complex structures appear in the histogram, it is fundamental to look into the data and operations more deeply.

The above bar graph is an example of the histogram with a “bell” shape.
However, it should be noted that just because the histogram displays a “bell” shaped distribution, that does not mean the process is only experiencing common cause variation. A deeper analysis should be done to investigate if there were other underlying factors or causes that lead towards the pattern of the distribution displayed in the histogram.
Countering common cause and special cause variation
Once the causes of the variation have been pinpointed, here comes the attempt to combat and resolve it. Different measures are implemented to counter different types of variation, i.e. common cause variation and special cause variation. Common cause variation is quite tough to be completely eliminated. Drastic or long-term process modification could be used to counter common cause variation. A new method should be introduced and constantly conducted to achieve the long-term goal of eliminating the common cause variation. Some other effects may happen to the operations but as time passes, the cause may be gradually solved. As for special cause variation, it could be countered using contingency plans. Usually, additional processes are implemented into the usual operation in order to counter the special cause variation.
- What To Do If You Have “A Perfect Student” Syndrome?
- How to Effectively Find and Use the Best Possible Suppliers in 2022
- 5 Reasons to Screen Potential Employees
- Why It’s Important to Hire an InventHelp Patent Attorney?
most recent

Top 33 Creditors Clerk Interview Questions and Answers 2024

Top 33 Walmart Assistant Manager Interview Questions and Answers 2024

Top 33 Assistant Property Manager Interview Questions and Answers 2024
© 2024 Copyright ProjectPractical.com
Table of Contents
Types of variance, common cause variation, common cause variation examples, special cause variation, special cause variation example, choose the right program, common cause variation vs. special cause variation.

Every piece of data which is measured will show some degree of variation: no matter how much we try, we could never attain identical results for two different situations - each result will be different, even if the difference is slight. Variation may be defined as “the numerical value used to indicate how widely individuals in a group vary.”
In other words, variance gives us an idea of how data is distributed about an expected value or the mean. If you attain a variance of zero, it indicates that your results are identical - an uncommon condition. A high variance shows that the data points are spread out from each other—and the mean, while a smaller variation indicates that the data points are closer to the mean. Variance is always nonnegative.
Are you looking forward to making a mark in the Project Management field? If yes, enroll in the PMP Certification Program now and get a step closer to your career goal!
Change is inevitable, even in statistics. You’ll need to know what kind of variation affects your process because the course of action you take will depend on the type of variance. There are two types of Variance: Common Cause Variation and Special Cause Variation. You’ll need to know about Common Causes Variation vs Special Causes Variation because they are two subjects that are tested on the PMP Certification and CAPM Certification exams.
Common Cause Variation, also referred to as “Natural Problems, “Noise,” and “Random Cause” was a term coined by Harry Alpert in 1947. Common causes of variance are the usual quantifiable and historical variations in a system that are natural. Though variance is a problem, it is an inherent part of a process—variance will eventually creep in, and it is not much you can do about it. Specific actions cannot be taken to prevent this failure from occurring. It is ongoing, consistent, and predictable.
Characteristics of common causes variation are:
- Variation predictable probabilistically
- Phenomena that are active within the system
- Variation within a historical experience base which is not regular
- Lack of significance in individual high and low values
This variation usually lies within three standard deviations from the mean where 99.73% of values are expected to be found. On a control chart, they are indicated by a few random points that are within the control limit. These kinds of variations will require management action since there can be no immediate process to rectify it. You will have to make a fundamental change to reduce the number of common causes of variation. If there are only common causes of variation on your chart, your process is said to be “statistically stable.”
When this term is applied to your chart, the chart itself becomes fairly stable. Your project will have no major changes, and you will be able to continue process execution hassle-free.
Become a Data Science & Business Analytics Professional
- 28% Annual Job Growth By 2026
- 11.5 M Expected New Jobs For Data Science By 2026
Data Scientist
- Industry-recognized Data Scientist Master’s certificate from Simplilearn
- Dedicated live sessions by faculty of industry experts
Big Data Engineer
- Live interaction with IBM leadership
- 8X higher live interaction in live online classes by industry experts
Here's what learners are saying regarding our programs:
A.Anthony Davis
Simplilearn has one of the best programs available online to earn real-world skills that are in demand worldwide. I just completed the Machine Learning Advanced course, and the LMS was excellent.
I encountered problems when trying to solve the projects in my Data Science class for Python. The Teaching Assistant was accommodating and provided step-by-step guidance through web chat sessions to resolve the issues.
Consider an employee who takes a little longer than usual to complete a specific task. He is given two days to do a task, and instead, he takes two and a half days; this is considered a common cause variation. His completion time would not have deviated very much from the mean since you would have had to consider the fact that he could submit it a little late.
Here’s another example: you estimate 20 minutes to get ready and ten minutes to get to work. Instead, you take five minutes extra to get ready because you had to pack lunch and 15 additional minutes to get to work because of traffic.
Other examples that relate to projects are inappropriate procedures, which can include the lack of clearly defined standard procedures, poor working conditions, measurement errors, normal wear and tear, computer response times, etc. These are all common cause variation.
Special Cause Variation, on the other hand, refers to unexpected glitches that affect a process. The term Special Cause Variation was coined by W. Edwards Deming and is also known as an “Assignable Cause.” These are variations that were not observed previously and are unusual, non-quantifiable variations.
These causes are sporadic, and they are a result of a specific change that is brought about in a process resulting in a chaotic problem. It is not usually part of your normal process and occurs out of the blue. Causes are usually related to some defect in the system or method. However, this failure can be corrected by making changes to affected methods, components, or processes.
Characteristics of special cause variation are:
- New and unanticipated or previously neglected episode within the system
- This kind of variation is usually unpredictable and even problematic
- The variation has never happened before and is thus outside the historical experience base
On a control chart, the points lie beyond the preferred control limit or even as random points within the control limit. Once identified on a chart, this type of problem needs to be found and addressed immediately you can help prevent it from recurring.
Let’s say you are driving to work, and you estimate arrival in 10 minutes every day. One day, it took you 20 minutes to arrive at work because you were caught in the traffic from an accident zone and were held up.
Examples relating to project management are if machine malfunctions, computer crashes, there is a power cut, etc. These kinds of random things that can happen during a project are examples of special cause variation.
One way to evaluate a project’s health is to track the difference between the original project plan and what is happening. The use of control charts helps to differentiate between the common cause variation and the special cause variation, making the process of making changes and amends easier.
Learn new trends, emerging practices, tailoring considerations, and core competencies required of a Project Management professional with the PMP Certification course .
Unlock your project management potential with Simplilearn's comprehensive training. Gain the skills and knowledge needed to lead successful projects, boost efficiency, and exceed goals. Choose the right project management course today and advance your career with confidence.
Program Name PMP® Certification Training Course PMP Plus Post Graduate Program In Project Management Geo All Geos All Geos All Geos University PMI Simplilearn University of Massachusetts Amherst Course Duration 90 Days of Flexible Access to Online Classes 36 Months 6 Months Coding experience reqd No No No Skills you wll learn 8+ PM skills including Work Breakdown Structure, Gantt Charts, Resource Allocation, Leadership and more. 6 courses including Project Management, Agile Scrum Master, Implementing a PMO, and More 9+ skills including Project Management, Quality Management, Agile Management, Design Thinking and More. Additional Benefits Experiential learning through case studies Global Teaching Assistance 35PDUs Learn by working on real-world problems 24x7 Learning support from mentors Earn 60+ PDU’s 3 year course access Cost $$ $$$$ $$$$ Explore Program Explore Program Explore Program
This article has explained special cause variation vs common cause variation which are the two important concepts in project management when it comes to data validation. Simplilearn offers multiple Project Management training courses like the Post Graduate Program in Project Management and learning paths that can help aspiring project managers get the education they need to pass not only exams like the PMP certification and CAPM® but also real-world knowledge useful for any project management career.
PMP is a registered mark of the Project Management Institute, Inc.
Our Project Management Courses Duration And Fees
Project Management Courses typically range from a few weeks to several months, with fees varying based on program and institution.
Get Free Certifications with free video courses
Data Science & Business Analytics
Introduction to Data Science
Introduction to Big Data Tools for Beginners
Learn from Industry Experts with free Masterclasses
Learner Spotlight: Watch How Prasann Upskilled in Data Science and Transformed His Career
Data Scientist vs Data Analyst: Breaking Down the Roles
Open Gates to a Successful Data Scientist Career in 2024 with Simplilearn Masters program
Recommended Reads
Four Proven Reasons Why Gamification Improves Employee Training
10 Major Causes of Project Failure
Data Analyst vs. Data Scientist: The Ultimate Comparison
Free eBook: Top 25 Interview Questions and Answers: Big Data Analytics
Root Cause Analysis: All You Need to Know
A Comprehensive Comparison of NFT Vs. Crypto
Get Affiliated Certifications with Live Class programs
- PMP, PMI, PMBOK, CAPM, PgMP, PfMP, ACP, PBA, RMP, SP, and OPM3 are registered marks of the Project Management Institute, Inc.

An official website of the United States government
The .gov means it’s official. Federal government websites often end in .gov or .mil. Before sharing sensitive information, make sure you’re on a federal government site.
The site is secure. The https:// ensures that you are connecting to the official website and that any information you provide is encrypted and transmitted securely.
- Publications
- Account settings
Preview improvements coming to the PMC website in October 2024. Learn More or Try it out now .
- Advanced Search
- Journal List
- HHS Author Manuscripts
Know It When You See It: Identifying and Using Special Cause Variation for Quality Improvement
In this month’s Hospital Pediatrics , Liao et al 1 share their team’s journey to improve the accuracy of their institution’s electronic health record (EHR) problem list. They presented their results as statistical process control (SPC) charts, which are a mainstay for visualization and analysis for improvers to understand processes, test hypotheses, and quickly learn their interventions’ effectiveness. Although many readers might understand that 8 consecutive points above or below the mean signifies special cause variation resulting in a centerline “shift,” there are many more special cause variation rules revealed in these charts that likely provided valuable real-time information to the improvement team. These “signals” might not be apparent to casual readers when looking at the complete data set in article form.
Shewhart 2 first introduced SPC charts to the world with the publication of Economic Control of Quality of Manufactured Product in 1931. Although control charts were initially used more broadly in industrial settings, health care providers have also recently begun to understand that the use of SPC charts is vital in improvement work. 3 , 4 Deming, 5 often seen as the “grandfather” of quality improvement (QI), saw SPC charts as vital to understanding variation as part of his well-known Theory of Profound Knowledge, outlined in his book The New Economics for Industry Government, Education . Improvement science harnesses the scientific method in which improvers create and rapidly test hypotheses and learn from their data to determine if their hypotheses are correct. 6 This testing is central to the Model for Improvement’s plan-do-study-act cycle. 3 Liao et al 1 nicely laid out their hypotheses in a key driver diagram, and they tested these hypotheses with multiple interventions. In the following paragraphs, we will walk through some of their SPC charts to demonstrate how this improvement team was gaining valuable knowledge about their hypotheses through different types of special cause variation long before they had 8 points to reveal shifts. We recommend readers have the charts from the original article (OA) available for reference.
A fundamental concept in improvement science is understanding the difference between common cause and special cause variation. By understanding how to apply these concepts to your data, you will more quickly identify when a change has occurred and whether action should be taken. The authors’ SPC charts reveal examples of both common cause and special cause variation.
Common cause variations are those causes that are inherent in the system or process. 4 Evidence of common cause variation can be seen visually in the OA’s Fig 3, from January 2017 to October 2017, because the data points vary around the mean but remain between the upper and lower control limits (dotted lines). In contrast, special cause variations are causes of variations that are not inherent to the system. 4 Although there are different rules that signify special cause variation in SPC charts, some of the most common rules that we will focus on here include (1) a single data point outside of the control limits, (2) 8 consecutive points above or below the mean line, and (3) ≥6 consecutive points all moving in the same direction, termed a “trend.” 4 When any of these occur, it is paramount to identify when and why the special cause occurred, learn from the special cause, and then take appropriate action. By quickly detecting special cause variation, improvement teams can more readily assess the impact of interventions by validating whether their hypothesis for improvement is correct.
An example of special cause variation can be seen in the OA’s Fig 2, noted by the shift in the centerline in May 2018 from a baseline of 70% of problem lists revised during admission to a new centerline of 90% of problem lists reviewed during admission. Notice that this new, stable process represented by the new centerline starts after the team tested 3 separate interventions that were directly testing hypotheses related to their key drivers. Although the shift began in May 2018, the first special cause signal the improvement team would have seen is the first point outside of the upper control limit in January 2018, which comes immediately after their first 2 interventions. As more months go by, each month after continues to represent special cause variation because they are outside of the control limits. Finally, when the data point in May 2018 is plotted, it is apparent that an upward trend started in December 2017, with 6 consecutive data points increasing through May 2018. Therefore, the authors recognized special cause variation (a trend) by having 6 consecutive increasing points. Given their interventions were grounded in theory and the temporal relationship of the trend beginning in December 2017, with the preceding interventions in November and December 2017, there is a high degree of belief that the interventions are driving these results. In other words, their hypothesis that the EHR enhancements, the dissemination of a protocol, and the designation of a bonus would improve the percentage of times that the problem list is “reviewed” was confirmed as early as December 2017, long before the eventual centerline shift in May 2018.
Figure 3 in the OA is an SPC chart of one of the team’s process measures revealing the percentage of discharges with duplicate codes on the problem list. The authors demonstrate that the November 2017 EHR impacted the process, reducing the mean from 12% to 7%. The data contained in our Fig 1 are the same data as those shown in Fig 3 of the authors’ OA but without the first centerline shift, which reveals what the authors would have seen in real time during the course of their improvement efforts. With the November 2017 data point (labeled point 1 in Fig 1 ), the authors immediately have evidence of special cause variation, with a point outside of the lower control limit after their intervention. This continues with points 2 through 5, each below the lower control limit. Statistically speaking, any one of these is unlikely to happen by chance (which is why they are considered special cause), but the fact that the team is seeing this month after month reinforced their hypothesis. With the eighth consecutive point below the mean line occurring in June 2018 (circle), the team was able to finally shift the centerline. Looking at this from the perspective of the improvement team, the immediacy and consistency of feedback that they witnessed with points outside of the control limits from November 2017 through March 2018 were likely much more informative to their improvement efforts than the moment when they finally were able to shift the mean line. The authors highlight that the EHR enhancement was chosen for its higher reliability design concept, 7 making it easier for the providers to complete the intended behavior. The immediacy of special cause signal in November 2017 would indicate that their hypothesis was correct.

OA Fig 3 re-designed to represent data visualization prior to centerline shift.
Finally, viewing charts in combination provides further support of the team’s overall improvement theory. Notice that the special cause shift in Fig 3 of the OA (a process measure) occurs at the same time as the beginning of the special cause that is noted in Fig 2 of the OA, which is their outcome measure. In this case, a driving change in their process was temporally associated with recognizable change in their outcome. Similarly, the OA’ Fig 4, viewed in combination with its Figs 2 and 3, provide our final example of how revealing special cause variation across measures relates to the broader theory of the team’s improvement. Special cause variation is evident in Fig 4 of the OA, with points outside of the control limits associated with interventions in both November and December 2019. A similar pattern is seen in the authors’ other process measure chart, Fig 3 of the OA, during those same months associated with those interventions. Here, a couple of associations are addressed in the data. First, a high degree of belief that those two interventions affect those measures is provided in the data, as the authors hypothesized. Second, with such data, the authors also confirm the hypothesis that underlies the entire article: simply “reviewing” the problem list is also associated with active management of the problem list, and improvements to their process measures help drive their outcome. After >1.5 years of a fairly stable outcome measure (mainly common cause variation), the team’s use of these two interventions not only improved their process measures but also were associated with the December 2019 data point being outside of the control limits in the outcome measure in Fig 2 of the OA. In these situations, the team’s use of SPC charts provided the ability to understand relationships between process and outcome measures, in addition to rapidly testing hypotheses.
As revealed in the work by Liao et al, 1 we can improve the care we provide to patients every day with QI methodology. When researchers use SPC charts to report QI in scholarly venues such as this, readers often focus on centerline shifts. Although improvement teams take great joy in shifting a centerline, experienced teams much more commonly work to detect other types of special cause variation quickly to test their hypotheses and work through plan-do-study-act cycles. By understanding the rules of special cause variation and applying them to data in real time, teams will be provided with information that will inform hypotheses testing, bolster knowledge about a system, and ultimately accelerate improvement work.
Acknowledgments
FUNDING: Supported by the Agency for Healthcare Research and Quality (grant T32HS026122). The content is solely the responsibility of the authors and does not necessarily represent the official views of the Agency for Healthcare Research and Quality.
FINANCIAL DISCLOSURE: The authors have indicated they have no financial relationships relevant to this article to disclose.
POTENTIAL CONFLICT OF INTEREST: The authors have indicated they have no potential conflicts of interest to disclose.
Lean Six Sigma Training Certification
- Facebook Instagram Twitter LinkedIn YouTube
- (877) 497-4462
What is Special Cause Variation? How to Identify It?
March 8th, 2024
Variations are inherent in any process and the sources of these variations play a crucial role in determining process performance and stability. While common cause variations are predictable and result from the process design itself, special cause variation arise due to unexpected factors and lead to process instability.
Managing these special cause variations by identifying and eliminating their root causes is an integral part of quality management frameworks like Six Sigma and Lean. By doing so, processes can achieve stability and enhanced capability.
This enables improved competitiveness through cost reduction, lead time reduction, improved quality, and higher customer satisfaction.
Thus, organizations invest significant efforts in detecting and managing special causes of variation in their business processes.
Understanding Special Cause Variation
Special cause variation refers to fluctuations in a process that happen because of unique or unusual factors that are not normally present.
These unnatural variations are unpredictable and assignable to a specific cause . They indicate that the process has become unstable and is producing defects or undesirable outcomes.
Difference from Common Cause Variation
Common cause variation refers to natural or expected variability that exists in any process. This type of variation happens due to minor, ubiquitous causes that are inherent in the process design.
Common causes lead to random scattering of data points around the mean. On the other hand, special causes produce data points that stand out from the normal pattern of variation and signal that the process is out of control.
While common cause variation indicates a stable process, special cause variation implies instability requiring investigation and corrective action.
Importance in Quality Management
Effective management of special cause variation is crucial for organizations looking to enhance their quality management programs.
By properly identifying and addressing special causes, companies can boost competitiveness, better meet customer expectations, and positively impact financials.
Enhancing Competitiveness with Special Cause Variation
In today’s business landscape, quality has become a key competitive differentiator across industries. Companies that demonstrate consistent product/service quality and continuous improvement initiatives can gain an edge.
The ability to rapidly detect and mitigate special causes of variation enables organizations to enhance process stability .
This prevents the occurrence of unexpected defects and non-conformances which can erode quality perception. Maintaining robust quality standards is essential to stay ahead.
Connecting with Quality-Focused Customers
Customers are increasingly assessing providers based on their quality management record and commitment to zero defects.
By tackling special cause variations through root cause analysis , corrective actions, and control mechanisms. etc. companies can limit unexpected issues that lead to customer dissatisfaction.
This accountability and proactive quality management culture aligns with customer requirements and values.
Communicating such initiatives and results also reassures customers regarding consistency. This helps strengthen loyalty and presents partnership opportunities with quality-focused customers.
Identifying Special Cause Variation
Special cause variation is often difficult to detect without the right analysis tools. Identifying special causes requires going beyond typical process monitoring to specialized statistical techniques.
There are three main methods for recognizing when variation is due to special causes:
Control Charts
Control charts are the most common way to identify special cause variation. Control charts plot data over time with statistically derived upper and lower control limits.
When data points fall outside these control limits , it indicates something unexpected has happened to the process.
This unexpected variance points to special causes rather than expected normal variation.
Common control charts used to monitor special causes include Xbar-R charts , Xbar-S charts , Individual charts, moving range charts, and P charts.
Statistical process control software makes it easy to generate control charts and receive alerts when special causes occur.
Statistical Process Control
Statistical process control (SPC) is an analytical methodology that makes extensive use of control charts.
SPC carefully monitors processes to distinguish between expected and unexpected variations using statistical methods.
By visually separating normal and special cause variations on control charts, SPC provides objective evidence that can pinpoint the timing and magnitude of special causes.
SPC also calculates metrics like Cp and Cpk that quantify overall process variation and process capability.
Tracking these metrics provides further insight into process stability versus areas with heightened special cause variation.
Root Cause Analysis
When control charts or SPC identify special cause variation, the next step is to determine the root cause. Root cause analysis gets to the underlying reason why the unexpected process change happened.
Various tools like the 5 Whys , fishbone diagrams , and failure mode analysis help uncover root causes. Tracing special cause variation back to the root cause is crucial for addressing problems permanently.
Otherwise, the same special cause could keep affecting the process unpredictably.
Implications of Special Cause Variation
Special cause variation can have major implications if left unchecked.
Understanding and properly dealing with special causes is crucial for organizations that want to achieve process stability, improve customer satisfaction, and boost financial performance.
Process Stability with Special Cause Variation
The presence of special cause variation indicates an unstable process. The output and performance metrics of an unstable process fluctuate unpredictably.
This makes the process unreliable and difficult to control. Identifying and eliminating special causes is the first step toward stabilizing a process.
Stable processes have consistent output and are predictable, easier to monitor, and simpler to improve.
Customer Satisfaction
Customers expect consistent quality and on-time delivery of products and services. An unstable process leads to unpredictable product quality and delivery delays which frustrates customers. Fixing special causes improves process stability and capability.
This enables organizations to reliably meet customer expectations and increase satisfaction levels. Satisfied customers lead to repeat purchases and valuable word-of-mouth publicity.
Financial Performance
Unstable processes lead to increased waste, rework, and returns. The additional effort and resources needed to fix these issues drive up costs and hurt profitability.
Special cause variation can also result in production and shipment delays that mean missed revenue opportunities and penalties.
Eliminating special causes reduces costs and improves process efficiency . This directly translates into increased profit margins, higher ROI, and stronger financial performance.
Strategies for Management of Special Cause Variation
Effectively managing special cause variation is critical for organizations looking to improve quality, reduce costs, and boost customer satisfaction.
When a process experiences special cause variation, it indicates an unexpected change that needs to be addressed. Implementing targeted strategies can help get processes back into a state of statistical control.
Corrective Actions
- Once a special cause is identified through statistical process control methods, structured problem-solving methodologies like PDCA (Plan-Do-Check-Act) or DMAIC (Define, Measure, Analyze, Improve, Control) can be utilized to develop corrective actions.
- Brainstorming sessions to determine potential causes and solutions can provide useful insights from team members. Fishbone diagrams are an effective tool to visually map out causes.
- Pilot testing proposed improvements on a small scale first to evaluate potential impact.
- Verify the effectiveness of corrective actions by monitoring the process over time using control charts. Special causes should be removed and variation should return to baseline common cause levels.
Continual Improvement with Special Cause Variation
- Schedule periodic reviews of processes, even in the absence of special causes, to identify opportunities for incremental improvements.
- Utilize lean tools like 5S , poka-yoke , and process mapping to reduce waste and enhance process stability.
- Keep the workforce engaged by encouraging them to share improvement ideas and recognize implementation efforts.
- Consider automating certain process steps to reduce variability induced by human errors.
- Review process performance metrics regularly to ensure improvements are sustained over longer periods.
- Conduct refresher training for employees on methods like statistical process control, Six Sigma, and hypothesis testing.
By taking a structured approach combining short-term corrective actions and long-term continual improvement , organizations can effectively manage special cause variation events.
This drives greater consistency and stability in processes, directly enhancing product quality and customer satisfaction.
SixSigma.us offers both Live Virtual classes as well as Online Self-Paced training. Most option includes access to the same great Master Black Belt instructors that teach our World Class in-person sessions. Sign-up today!
Virtual Classroom Training Programs Self-Paced Online Training Programs
SixSigma.us Accreditation & Affiliations

Monthly Management Tips
- Be the first one to receive the latest updates and information from 6Sigma
- Get curated resources from industry-experts
- Gain an edge with complete guides and other exclusive materials
- Become a part of one of the largest Six Sigma community
- Unlock your path to become a Six Sigma professional
" * " indicates required fields
SPECIAL CAUSES OF VARIATIONS
- Reference work entry
- Cite this reference work entry

167 Accesses
W Edwards Deming elaborated on Walter A. Shewhart's argument that variability in manufacturing and service processes can be traced to either common causes or special causes of variations (Shewhart's assignable causes). Special causes variability is beyond the natural variability of the process. Special cause variability can be identified and addressed by operators. Examples of special causes are operator error, faulty setup, or incoming defective raw material. Deming believed that only about 15% of the variation in a process is due to special causes. Deming relied on control charts to describe both the natural variability of the system, and to detect the existence of a special causes of variation. A process that is operating with special causes of variation is said to be “out of statistical control.”
See Quality: The implications of W. Edwards Deming's approach ; Statistical process control using control charts ; Total quality management .
This is a preview of subscription content, log in via an institution to check access.
Access this chapter
- Available as PDF
- Read on any device
- Instant download
- Own it forever
Tax calculation will be finalised at checkout
Purchases are for personal use only
Institutional subscriptions
Deming, W. Edwards (1982). Out of the Crisis, Center for Advanced Engineering Study, Massachusetts.
Google Scholar
Deming, W. Edwards (1982). Quality, Productivity, and Competitive Position, Center for Advanced Engineering Study, Massachusetts Institute of Technology, Cambridge, Massachusetts.
Download references
Editor information
Rights and permissions.
Reprints and permissions
Copyright information
© 2000 Kluwer Academic Publishers
About this entry
Cite this entry.
(2000). SPECIAL CAUSES OF VARIATIONS . In: Swamidass, P.M. (eds) Encyclopedia of Production and Manufacturing Management. Springer, Boston, MA . https://doi.org/10.1007/1-4020-0612-8_905
Download citation
DOI : https://doi.org/10.1007/1-4020-0612-8_905
Publisher Name : Springer, Boston, MA
Print ISBN : 978-0-7923-8630-8
Online ISBN : 978-1-4020-0612-8
eBook Packages : Springer Book Archive
Share this entry
Anyone you share the following link with will be able to read this content:
Sorry, a shareable link is not currently available for this article.
Provided by the Springer Nature SharedIt content-sharing initiative
- Publish with us
Policies and ethics
- Find a journal
- Track your research
Using control charts to detect common-cause variation and special-cause variation
In this topic, what are common-cause variation and special-cause variation, what special-cause variation looks like on a control chart, using brainstorming to investigate special-cause variation, don't overcorrect your process for common-cause variation.
Some degree of variation will naturally occur in any process. Common-cause variation is the natural or expected variation in a process. Special-cause variation is unexpected variation that results from unusual occurrences. It is important to identify and try to eliminate special-cause variation. Out-of-control points and nonrandom patterns on a control chart indicate the presence of special-cause variation.
Examples of common-cause and special-cause variation
A process is stable if it does not contain any special-cause variation; only common-cause variation is present. Control charts and run charts provide good illustrations of process stability or instability. A process must be stable before its capability is assessed or improvements are initiated.

This process is stable because the data appear to be distributed randomly and do not violate any of the 8 control chart tests.

This process is not stable; several of the control chart tests are violated.
A good starting point in investigating special-cause variation is to gather several process experts together. Using the control chart, encourage the process operators, the process engineers, and the quality testers to brainstorm why particular samples were out of control. Depending on your process, you may also want to include the suppliers in this meeting.
- Which samples were out of control?
- Which tests for special causes did the samples fail?
- What does each failed test mean?
- What are all the possible reasons for the failed test?
A common method for brainstorming is to ask questions about why a particular failure occurred to determine the root cause (the 5 why method). You could also use a cause-and-effect diagram (also called fishbone diagram).
While it's important to avoid special-cause variation, trying to eliminate common-cause variation can make matters worse. Consider a bread baking process. Slight drifts in temperature that are caused by the oven's thermostat are part of the natural common-cause variation for the process. If you try to reduce this natural process variation by manually adjusting the temperature setting up and down, you will probably increase variability rather than decrease it. This is called overcorrection.
- Minitab.com
- License Portal
- Cookie Settings
You are now leaving support.minitab.com.
Click Continue to proceed to:
Know It When You See It: Identifying and Using Special Cause Variation for Quality Improvement
Affiliations.
- 1 Division of Pediatric Hospital Medicine, Department of Pediatrics, School of Medicine, Vanderbilt University and Monroe Carell Jr Children's Hospital at Vanderbilt, Nashville, Tennessee [email protected].
- 2 Division of Pediatric Hospital Medicine, Department of Pediatrics, School of Medicine, Vanderbilt University and Monroe Carell Jr Children's Hospital at Vanderbilt, Nashville, Tennessee.
- PMID: 33051243
- PMCID: PMC7891129
- DOI: 10.1542/hpeds.2020-002303
In this month’s Hospital Pediatrics , Liao et al share their team’s journey to improve the accuracy of their institution’s electronic health record (EHR) problem list. They presented their results as statistical process control (SPC) charts, which are a mainstay for visualization and analysis for improvers to understand processes, test hypotheses, and quickly learn their interventions’ effectiveness. Although many readers might understand that 8 consecutive points above or below the mean signifies special cause variation resulting in a centerline “shift,” there are many more special cause variation rules revealed in these charts that likely provided valuable real-time information to the improvement team. These “signals” might not be apparent to casual readers when looking at the complete data set in article form.
Shewhart first introduced SPC charts to the world with the publication of Economic Control of Quality of Manufactured Product in 1931. Although control charts were initially used more broadly in industrial settings, health care providers have also recently begun to understand that the use of SPC charts is vital in improvement work. , Deming, often seen as the “grandfather” of quality improvement (QI), saw SPC charts as vital to understanding variation as part of his well-known Theory of Profound Knowledge, outlined in his book The New Economics for Industry Government, Education . Improvement science harnesses the scientific method in which improvers create and rapidly test hypotheses and learn from their data to determine if their hypotheses are correct. This testing is central to the Model for Improvement’s plan-do-study-act cycle. Liao et al nicely laid out their hypotheses in a key driver diagram, and they tested these hypotheses with multiple interventions. In the following paragraphs, we will walk through some of their SPC charts to demonstrate how this improvement team was gaining valuable knowledge about their hypotheses through different types of special cause variation long before they had 8 points to reveal shifts. We recommend readers have the charts from the original article (OA) available for reference.
A fundamental concept in improvement science is understanding the difference between common cause and special cause variation. By understanding how to apply these concepts to your data, you will more quickly identify when a change has occurred and whether action should be taken. The authors’ SPC charts reveal examples of both common cause and special cause variation.
Publication types
- Research Support, U.S. Gov't, P.H.S.
- Inpatients*
- Quality Improvement*
Grants and funding
- T32 HS026122/HS/AHRQ HHS/United States
Common Cause and Special Cause

Common Cause and Special Cause in Statistics: Understanding Variability
Statistics is a powerful tool for analyzing data and making informed decisions, but to do so effectively, it’s essential to understand the sources of variability within a process or system.
In the realm of statistical process control , two fundamental concepts come into play: common cause and special cause variation. These concepts help us differentiate between the everyday fluctuations in a process and the exceptional, identifiable factors that can lead to significant deviations from the norm.
Common Cause Variation
Common cause variation, often called random variation or systemic variation, is the inherent variability in any process. It is the everyday, expected variation that occurs when a system is stable and operating under normal conditions.
This type of variation is the result of numerous factors and interactions within a process, and it cannot be traced back to a specific source. Common cause variation is, in a sense, the “background noise” of a process.
Key characteristics of common cause variation include:
- Inherent to the Process: Common cause variation is an inherent part of a process and will always exist to some degree.
- Consistent Patterns: It typically follows consistent, predictable patterns, often resembling a bell-shaped curve (a normal distribution).
- Random and Unpredictable: It is random in nature and cannot be attributed to any specific factor or event. This makes it difficult to control or eliminate entirely.
- Small Fluctuations: Common cause variation results in small, manageable fluctuations around a process’s mean or average value.
Examples of common cause variation can include minor temperature fluctuations in a manufacturing process, small variations in delivery times, or slight variations in the weight of identical products produced on the same assembly line.
Special Cause Variation
Special cause variation, also known as assignable variation or non-random variation, is the opposite of common cause variation. It represents variability in a process that can be traced back to specific, identifiable causes. Unlike common cause variation, which is inherent to the process, special cause variation is due to external factors or events that disrupt the system’s normal functioning.
Key characteristics of special cause variation include:
- Identifiable Causes: Special cause variation can be linked to specific events, actions, or factors that are not part of the usual operation of the process.
- Erratic Patterns: Unlike the consistent patterns of common cause variation, it often exhibits erratic and unpredictable patterns.
- Large Fluctuations: Special cause variation results in significant deviations from a process’s mean or average value.
- Unusual Events: Examples of special cause variation can include equipment breakdowns, power outages, errors in data entry, or major shifts in market demand.
Differentiating Between Common Cause and Special Cause Variation
Distinguishing between common cause and special cause variation is crucial in process improvement and quality control. Understanding the source of variability in a process allows organizations to take appropriate actions.
Here are some guidelines for differentiation:
- Data Analysis: The first step is to collect and analyze data. If the variation observed falls within the expected range of common cause variation, it is likely due to inherent process variability. However, if the data points exhibit patterns or values that deviate significantly from the norm, special cause variation may be present.
- Statistical Tools: Various statistical techniques, such as control charts, can be used to monitor processes and identify abnormal data points that suggest special cause variation. Control charts help in distinguishing between natural process variation and unusual occurrences.
- Root Cause Analysis: When special cause variation is suspected, a thorough root cause analysis is essential. This involves investigating the specific factors that contributed to the variation and taking corrective actions to prevent its recurrence.
- Process Control: Once special cause variation is identified and addressed, process control measures can be put in place to minimize the risk of future occurrences.
How can we Minimize Common Cause Variation?
Minimizing common cause variation is a key goal in statistical process control and quality improvement. While common cause variation is inherent to any process and cannot be completely eliminated, there are several strategies and approaches that can help reduce its impact and maintain greater process stability. Here are some ways to minimize common cause variation:
- A thorough understanding of the process is the first step in minimizing common cause variation. You need to know how the process operates, what factors affect it, and the expected sources of variability.
- Implement process control tools, such as control charts, to continuously monitor the process. Control charts help in distinguishing between common cause and special cause variation. They visually represent the process’s performance over time, making it easier to detect trends or shifts.
- Develop and maintain standardized operating procedures for the process. SOPs ensure that everyone involved follows the same methods and practices, reducing variability in human factors and operational choices.
- Invest in the training and skill development of employees involved in the process. A well-trained workforce is less likely to introduce unnecessary variability through errors or inconsistent practices.
- Regularly maintain and calibrate equipment to minimize common cause variation associated with machinery or tools. Well-maintained equipment is more likely to produce consistent results.
- Use statistical techniques to understand the inherent variability in the process. By analyzing the process’s capability and identifying areas with excessive common cause variation, you can make data-driven decisions to improve it.
- Implement Lean Six Sigma principles to identify and eliminate waste and non-value-added steps in the process. This can help streamline operations and reduce variability.
- Use DOE methodologies to study the impact of various process factors on variability systematically. This approach can help optimize processes and identify which factors have the most significant impact on common cause variation.
- Form cross-functional teams to focus on process improvement. Teams can work together to identify sources of common cause variation, develop solutions, and ensure continuous process optimization.
- Make decisions based on data and evidence rather than intuition. Data-driven decisions allow for a better understanding of the process’s performance and the identification of areas where common cause variation can be reduced.
- Establish feedback loops to ensure that lessons learned from past performance are used to make continuous improvements. Regularly review and update process documentation, procedures, and best practices.
- Compare your process performance to industry benchmarks and best practices. Benchmarking can help identify areas where your process may be underperforming and experiencing excessive common cause variation.
- Encourage employees to provide feedback and suggestions for process improvement. They often have valuable insights into daily operations and can help identify and address common cause variation.
Minimizing common cause variation is an ongoing effort requiring a systematic process improvement approach. Organizations can reduce variability and enhance their processes’ overall quality and performance by consistently monitoring, analyzing, and making data-driven adjustments.
How does Common Cause and Special Cause Apply in Six Sigma Projects
Common cause and special cause variation are fundamental concepts in Six Sigma, a structured and data-driven methodology for process improvement. Understanding these concepts is crucial for identifying, analyzing, and addressing variations within processes to reduce defects and improve overall quality. Here’s how common cause and special cause apply in Six Sigma projects:
- Defining the Problem (Define Phase): In the Define phase of a Six Sigma project, the team identifies the problem that needs to be addressed. At this stage, it’s essential to differentiate between common cause and special cause variation. Common cause variation represents the inherent variability in the process, while special cause variation signifies exceptional factors causing deviations from the norm. This distinction helps in setting realistic improvement goals and understanding the scope of the project.
- Data Collection and Analysis (Measure Phase): The Measure phase involves collecting data to quantify the performance of the process and determine its capability. Six Sigma practitioners use statistical tools and control charts to identify patterns in the data. Control charts help distinguish between common cause and special cause variation. Common cause variation is typically represented by data points within control limits, while data points beyond these limits suggest special cause variation.
- Root Cause Analysis (Analyze Phase): Once special cause variation is identified in the Measure phase, the Analyze phase focuses on determining the specific causes of these exceptional variations. Root cause analysis techniques, such as the “5 Whys,” Fishbone diagrams, or Failure Modes and Effects Analysis (FMEA), are employed to understand the underlying factors responsible for special cause variation. Addressing these root causes is critical for process improvement.
- Improvement Actions (Improve Phase): In the Improve phase , the Six Sigma team devises and implements solutions to eliminate or mitigate the root causes of special cause variation. Improvement actions are carefully planned, tested, and validated to ensure that the process becomes more stable and predictable.
- Monitoring and Control (Control Phase): The Control phase is about sustaining the improvements made during the project. Common cause variation is continuously monitored through control charts, and process performance is measured against the new standards. The control plan, established in this phase, ensures that the process remains in control and that deviations due to common cause variation are promptly identified and addressed.
- Continuous Improvement: Six Sigma is inherently focused on continuous improvement. Common cause variation is always present but can be further reduced and managed through ongoing efforts. Teams conduct periodic reviews and data analysis to detect changes in process performance and address any new sources of special cause variation.
Six Sigma projects involve a structured approach to addressing both common cause and special cause variation. While common cause variation represents the natural variability in a process, special cause variation results from specific, identifiable issues.
A Six Sigma project aims to minimize both types of variation to improve process performance and quality. This requires a combination of data analysis, root cause analysis, process improvement efforts, and ongoing monitoring to ensure that the improvements are sustained over time.
In the world of statistics and quality control, understanding the concepts of common cause and special cause variation is vital for making informed decisions and improving processes. Common cause variation is the inherent, expected variation in a process, while special cause variation represents unusual and identifiable sources of variability. By distinguishing between these two types of variation, organizations can work towards greater process stability, predictability, and overall quality improvement.
Six Sigma Certifications
Six Sigma Resource Center
Common Cause and Special Cause Data (.pdf)
- All Certifications
- Accessibility

Connect With Us
Copyright MSI. All Rights Reserved.
Common Cause - Special Cause
We hope you enjoyed this lesson.
Get the Statistical Process Control course for more great video tutorials.
Start free trial
Cool lesson, huh? Share it with your friends
Facebook Twitter LinkedIn WhatsApp Email
- Lesson resources Resources
- Quick reference Reference
About this lesson
Exercise files.
Download this lesson’s related exercise files.
Quick reference
SPC Control Charts are designed to differentiate between special cause variation and common cause variation. In order to understand the importance of this and the implication for control, this lesson explains and illustrates the difference.
When to use
Common cause variation is always present in a process. Special cause variation is present in an unstable process. Whenever a process manager seeks to control a process, he or she needs to separate the variation into the appropriate categories so that appropriate actions can be taken.
Instructions
SPC control charts are used to identify the differences between common cause variation and special cause variation. Once the process manager has determined the root cause for special cause variation and eliminated it, the remaining common cause variation is placed under statistical control in order to maintain a predictable process. For this reason, it is important that we clearly understand the differences between these two types of variation.
Common Cause
Common cause variation is the variation that is inherent in the design of the process characteristics. It is the typical variation between process operators, or the variation in equipment performance due to normal usage, it could even be differences in process performance due to environmental factors like heat, cold, or time of day. In one sense this variation is random, in another sense it is not. It is random to the extent that we don’t know if it will be higher or lower than the average value. However, the magnitude is not totally random. There is a normal range for the random variation that it will not exceed. Because of this, we can statistically model and predict the impact of the random variation on process performance. Finally, random variation can only be changed by making a fundamental process change so that the factors outlined earlier are different.
Special Cause
Special cause variation is not due to the inherent variation within the process design. It has as a unique root cause that is outside the inherent process operational characteristics. This root cause is not something the operator is normally monitoring and controlling. The occurrence of this root cause is unpredictable in timing and the magnitude of the impact is also unpredictable. That is why we say that the presence of a special cause variation leads to an unstable or unpredictable process. This unpredictability cannot be mathematically modeled and used to predict normal process performance. It is important to note that special cause variation is not always negative variation. Special causes may change important process parameters that reduce the inherent common cause variation within a process. This is referred to as the Hawthorne Effect – named after a research study conducted in Hawthorne, Illinois. In this study of worker productivity, it was determined that the primary influence on worker productivity was the special cause of having all the study specialists observing the worker’s behavior. Since they knew they were being studied, the worker changed their normal practice to be much more careful – but only when they were being watched.
Common Cause – Special Cause – Control Charts
Control charts are designed to differentiate between common cause variation and special cause variation. This is so the process managers and operators can remove the special cause variation which makes the process predictable. At that point, they can either maintain the normal variation or consider a fundamental change to the process to reduce the magnitude of the normal variation in the process. The operator should never chase the ups and downs of normal variation. Doing that will introduce process tampering which often leads to overcontrolling of the output and makes the overall performance even worse.
Hints & tips
- Identify and resolve special cause variation before attempting to make changes to the process and influencing common causes.
- Beware if tampering – it is an easy trap to fall into. It may give a short term benefit, due to the Hawthorne effect. But unless the process is fundamentally changed, it will go back to the original levels of common cause variation.…
- 00:04 Hi, I'm Ray Sheen.
- 00:06 Let's review the concepts of common cause and special cause variation.
- 00:11 A primary purpose of SPC charts is to identify the presence and
- 00:15 the magnitude of each of these variation categories.
- 00:19 I’ll start with what I mean by categories of variation.
- 00:23 All process variation can be divided into one of two categories.
- 00:27 The first is common cause variation.
- 00:30 This variation is always present, even in a stable process.
- 00:33 It’s inherent in the physical design and operation of the process.
- 00:37 Because it is always present, we can measure it and
- 00:40 establish a baseline of the normal variation using statistical techniques.
- 00:44 The specific instance of variation on any process run is random, but
- 00:49 is always within a set of boundaries that are predictable.
- 00:52 There are limits to this normal variation, which we can calculate and
- 00:55 plot on our control charts.
- 00:58 The second category of variation is special cause variation.
- 01:01 This is associated with unstable processes because it is not predictable.
- 01:06 It is due to something unusual.
- 01:08 Often, that something is poor process management by the business managers or
- 01:12 the process operators.
- 01:14 This type of variation is not predictable.
- 01:17 We can neither predict when it will occur or
- 01:19 what the magnitude of the value will be when it does occur.
- 01:22 Therefore, when it happens it creates an unexpected process performance, and
- 01:26 often requires special action to restore performance.
- 01:30 Let's look at each of these in a little more detail.
- 01:33 I'll start with common cause.
- 01:35 Common cause variation is always present and
- 01:37 is predictable with respect to the magnitude.
- 01:39 Therefore, it should be accounted for when setting process performance targets, and
- 01:44 allowed for within the tolerances on those performance targets.
- 01:48 Let me clarify the nature of randomness of common cause variation.
- 01:52 It is random with respect to any specific occurrence of variation.
- 01:56 Might be a little high or a little low as compared to normal performance, but
- 01:59 that variation is always within predictable magnitude range.
- 02:03 That means we can establish a normal range and a predictable variation.
- 02:08 What we can't do is eliminate common cause variation by taking some form of special
- 02:12 corrective action to chase the variation.
- 02:15 By that I mean if we follow the process and results are a little higher than
- 02:19 normal, we try to tweak the process to be a little lower to compensate.
- 02:23 Think about the young teenager learning to drive.
- 02:26 They over control the car while trying to stay in their lane and
- 02:29 end up going way outside the lines.
- 02:31 Trying to compensate for each occurrence of common cause variation creates
- 02:35 process tampering as a special cause, and normally results in an unstable process.
- 02:41 Okay, now let's look at special cause variation.
- 02:44 When Special Cause variation is present, we say the process is unstable.
- 02:48 That's because the process performance is no longer predictable.
- 02:51 Special Cause variation is not controllable by the process operator.
- 02:56 Therefore, they don't know what the process results will be on any given
- 02:59 run of the process.
- 03:00 Now, you may be thinking, well, that's true for common cause variation also.
- 03:04 The part of that is true for common cause variation is that
- 03:07 you don't know precisely what the process result will be, but you do
- 03:11 know that it will fall within predictable limits of common cause variation.
- 03:15 The problem with special cause is that it falls outside those limits
- 03:19 of common cause variation and you have no ability to predict how far outside.
- 03:24 Special Cause variation is unpredictable, but it's not random.
- 03:27 It has a clear cause that precipitates the variation.
- 03:30 There is a clear, identifiable root cause that if it had not occurred,
- 03:34 there would have been no Special Cause variation.
- 03:37 The good news about that is that sometimes we can find out
- 03:39 what created that underlying root cause and we can take actions to prevent it and
- 03:44 eliminate the Special Cause variation from occurring again.
- 03:48 One other point, the Special Cause variation is not always bad.
- 03:51 Sometimes it is special good.
- 03:53 This means that there is some root cause that is preventing normal cause variation
- 03:57 from occurring.
- 03:58 This can give us a false sense of the range for normal variation.
- 04:02 There's a famous research study conducted in Hawthorne, Illinois,
- 04:05 that illustrated this point.
- 04:07 The purpose of the study was to determine the effect of adding lighting
- 04:10 to the workplace of an industrial assembly line.
- 04:12 Well, first this test was done to establish a baseline without
- 04:15 lighting present.
- 04:16 Then lighting was added and the productivity was measured.
- 04:19 It had improved and
- 04:21 the sponsor of the research, a lighting company, was excited by the results.
- 04:25 However, the researchers did one more assessment.
- 04:28 They turned the lights off and measured productivity again, and
- 04:31 it had improved even more.
- 04:33 So the research said that the best productivity was
- 04:35 achieved when you installed lighting but turned it off.
- 04:39 Yeah, I agree.
- 04:40 That doesn't make much sense.
- 04:41 But with further study,
- 04:43 they found that while lighting helped, the biggest effect on productivity was
- 04:47 having all those researchers there in the factory collecting data all the time.
- 04:51 This was a special cause that disrupted the normal work habits of the people on
- 04:55 the production line.
- 04:56 So let's wrap this up with a comparison of common cause and Special Cause variation.
- 05:02 Common cause is the normal and predictable variation that occurs within a process.
- 05:07 It's predictable in the sense of the magnitude always falls within limits or
- 05:10 boundaries of process performance.
- 05:13 It is always present because it is inherent in the process design.
- 05:17 The predictable aspect allows us to mathematically model this variation,
- 05:20 which let's us establish defined limits for it.
- 05:23 One last point,
- 05:24 it cannot be eliminated by the process operators taking special action.
- 05:28 The only way to improve it is to fundamentally change the process
- 05:33 to one with different physical characteristics, and
- 05:35 therefore, lower levels of random variation.
- 05:39 In contrast, the special cause variation is unpredictable.
- 05:43 The process operator does not know when it will occur.
- 05:45 And if it does occur, the operator is unable to predict the process results
- 05:50 due to the impact of the special cause.
- 05:52 It is outside of the control of the process operator,
- 05:55 which is why we say it makes the process unstable.
- 05:59 The occurrence and magnitude cannot be mathematically predicted.
- 06:02 It is based upon some external unique root cause.
- 06:05 Now, although the operator cannot control the effect,
- 06:08 sometimes they can control the conditions that allow the unique root cause to occur.
- 06:13 In that case, it can be preventable.
- 06:16 This review of the principles of common cause variation and special cause
- 06:20 variation was necessary because we are about to see that SPC control charts
- 06:24 are designed to differentiate between these two types of variation.
Lesson notes are only available for subscribers.
PMI, PMP, CAPM and PMBOK are registered marks of the Project Management Institute, Inc.
© 2024 GoSkills Ltd. Skills for career advancement

- ASQ® CQA Exam
- ASQ® CQE Exam
- ASQ® CSQP Exam
- ASQ® CSSYB Exam
- ASQ® CSSGB Exam
- ASQ® CSSBB Exam
- ASQ® CMQ/OE Exam
- ASQ® CQT Exam
- ASQ® CQPA Exam
- ASQ® CQIA Exam
- 7 Quality Tools
- Quality Gurus
- ISO 9001:2015
- Quality Cost
- Six Sigma Basics
- Risk Management
- Lean Manufacturing
- Design of Experiments
- Quality Acronyms
- Quality Awareness
- Quality Circles
- Acceptance Sampling
- Measurement System
- APQP + PPAP
- GD&T Symbols
- Project Quality (PMP)
- Full List of Quizzes >>
- Reliability Engineering
- Statistics with Excel
- Statistics with Minitab
- Multiple Regression
- Quality Function Deployment
- Benchmarking
- Statistical Process Control
- Quality Talks >> New
- Six Sigma White Belt
- Six Sigma Yellow Belt
- Six Sigma Green Belt
- Six Sigma Black Belt
- Minitab 17 for Six Sigma
- Casio fx-991MS Calculator
- CSSYB/LSSYB Mock Exam
- CSSGB/LSSGB Mock Exam
- CSSBB/LSSBB Mock Exam
- ASQ® CQA Preparation
- ASQ® CQE Preparation
- ASQ® CQPA Preparation
- ASQ® CQIA Preparation
- CQE Mock Exams
- CMQ/OE Mock Exams
- CQA Mock Exams
- CQIA Mock Exams
- CQPA Mock Exam
- CQT Mock Exam
- CQI Mock Exam
- CSQP Mock Exam
- Design of Experiments (DoE)
- Measurement System Analysis
- Statistics Using R
- Data Visualization with R
- Statistics Using Python
- Data Visualization with Python
- Regression with Minitab
- Logistic Regression
- Data Analysis Using Excel
- The Git Mindset
- Statistics Quiz
- Root Cause Analysis
- Kano Analysis
- Lean Management
- QMS Lead Auditor
- Quality Management
- ISO 9001:2015 Transition
- Project Quality Manager
- गुणवत्ता.org
- Summary Sheets
- Practice Tests
- QG Hall of Fame
- Testimonials – ASQ Exams Preparation
Difference Between , Qualitypedia , Six Sigma
- Special Cause vs. Common Cause Variation
** Unlock Your Full Potential **
What is the variation?
Whatever measurement we take, there is always a variation between these measurements. No two items or measurements are precisely the same.
The problem with the variation is that it is the enemy of quality. Variation and quality do not go hand in hand. Variation reduction is one of the significant challenges of quality professionals.
Two types of variation, and why is it important to differentiate?
When dealing with variation, the challenge quality professionals face when to act and when not to act. Because if you act on each and every variation in the process and adjust the process, this will be a never-ending process. Dr. Deming called this "tempering the process." Rather than improving the quality, tempering, in fact, reduces the quality. Deming demonstrated the effect of tempering with the help of a funnel experiment.
The causes of variation can be classified into two categories:
- Common Causes
- Special Causes
Statistical Process Control Bootcamp
- $130 course for just $15.99 today!
- Learn Control Charts , Process Capability using Excel and Minitab
- 7+ hours of videos, slides & quizzes

Common Cause Vs Special Cause: Types of Variation
Common cause variation is the natural variation in the process. It is a part of the process. There are "many" causes of this type of variation, and it is not easy to identify and remove these. You will need to live with them unless drastic action is taken, such as process re-engineering.
Common causes are also called n atural causes, noise, non-assignable and random causes .
Special cause variation, on the other hand, is the unexpected variation in the process. There is a specific cause that can be assigned to the variation. For that reason, this is also called as the assignable cause . You are required to take action to address these variations.
Special causes are also called assignable causes .
Seven Basic Quality Tools
- Get this $135 course for just $13.99 today!
- 3+ hours of videos, slides & quizzes

Control Charts to identify special causes
If the measurements of a process are normally distributed, then there is a 99.73% chance that the measurement will be within plus and minus three standard deviations. This is the basis of control charts .
If you plot the measurements on a Control Chart , then any measurements which are outside the plus and minus three standard deviation limits are expected to be because of a special cause. These limits are called as the Upper Control Limit (UCL) and the Lower Control Limits (LCL), Once you get such measurement, you are expected to investigate, do the root cause analysis , find out the reason for such deviation and take necessary actions.
Root Cause Analysis - Online Training
- 8+ hours of videos, slides & quizzes

Similar Posts:
June 8, 2023
Population vs. Sample: Understanding the Difference
December 22, 2022
Union and Intersection in Probability
December 3, 2018
Preventing Six Sigma Failure

49 Courses on SALE!

Common-Cause vs. Special-Cause
Common-cause variation is where no one, or combination of factors is unduly affected the process variation (random variation). special-cause variation is when one or more factors are affecting the process variation in a non-random way. with special-cause variation, one should be able to identify, or put their finger on the reason behind the unexpected variation..
Common-cause variation is where no one, or combination of factors is unduly affected the process variation (random variation). Special-cause variation is when one or more factors are affecting the process variation in a non-random way. With special-cause variation, one should be able to identify, or put their finger on the reason behind the unexpected variation .
Your cart is empty
Skill up for the Present & Future With 100+ Professional Courses by MindCypress
Common Cause Variation vs. Special Cause Variation: Key Differences
It is quite essential to understand variation pertaining to process involvement and quality management, for achieving organizational success. Variations are of two types: Common Cause variation and Special Cause Variation.
Both types play a significant role that helps determine the stability and performance of processes.
In this blog, we will explain the key differences between the two types of variation with the help of real-world examples for a better understanding.

Common Cause Variation
Common cause variation is innate and a natural part of any process and its operation. It depicts normal fluctuations that occur over time due to factors innate in the process itself. The process operates within certain statistical limits under normal conditions. Hence, it is stable and predictable.
- Daily fluctuations in call volumes at a customer service center
- Minor variations in product dimensions during manufacturing
- Variability in delivery times for routine shipments
Special Cause Variation
Special cause variation is caused by an external factor. It is not innate in the process and leads to outcomes that are unpredictable and uncommon. Special cause variation can lead to striking deviations as opposed to expected and stable outcomes.
- Machine breakdowns leading to production delays.
- Employee errors resulting in quality defects.
- Supplier issues causing disruptions in the supply chain.
Key Differences
- It is innate and a natural part of any process and its operation with natural fluctuations
- Special cause variation is caused by an external factor. It is not innate in the process.
Predictability
- Common cause variation is predictable and stable, operating within certain statistical limits.
- Special cause variation is unpredictable and can result in significant deviations from the expected performance of the process.
Management Approach
- Common cause variation requires process improvements and adjustments to reduce variability and enhance stability over time.
- Special cause variation requires immediate investigation and corrective action to address the root cause and prevent recurrence.
In summary, there are two different types of variation that affect the stability and performance of processes. Special cause variation arises from outside influences that have unanticipated effects, whereas the other variation reflects intrinsic natural oscillations in the process. Organizations can optimize process performance, improve quality, and promote continuous improvement by utilizing suitable management practices and comprehending the fundamental distinctions between various types of variation.
Are you looking for an opportunity to learn more about quality management? MindCypress offers Lean Six Sigma Green Belt certification training and Lean Six Sigma Black Belt certification through live online training. The online training equips learners with the necessary knowledge and skills to start their careers in their desired fields.

Navigating Special Cause Variation in Quality Control
Updated: May 11, 2023 by Ken Feldman
Variation exists in every process. To properly manage your process variation, you need to distinguish between the variation caused by the process inputs and that of special causes.
Overview: What is a special cause?
Famed statistician, Dr. W. Edwards Deming, coined the phrases common cause variation and special or assignable cause variation . Deming described common cause variation as the natural fluctuation in your process caused by the inputs or elements of the process. Since it is the baseline condition of your process, any attempt to change the variation will require fundamental changes in the inputs.
Special cause variation refers to unexpected and assignable events which can affect a process. These are variations that were not observed before and are unusual, non-quantifiable variations. Special cause variation may be sporadic. It is not usually part of your normal process and seems to just unexpectedly occur.
Special cause variation does not imply something is good or bad. You can unexpectedly have something happen which improves the process or makes it worse. The appropriate action is to investigate and try to uncover the assignable cause. Once you have discovered the cause, you can either incorporate the cause if the process was made better or eliminate it if the process was made worse.
An industry example of special cause
The company’s Six Sigma Black Belt (BB) was helping the manufacturing manager monitor his machine setup time with a control chart. He noticed that at point 65, an upward trend of consecutively increasing times began. This was shown as a series of increasing red data points. The manager was concerned with the increasing setup times since this would have a negative impact on his schedule.
The BB put together a small team of machine operators who identified the reason for the increasing times. Since this was having a negative effect on the process, they made recommendations to reduce the times back to the common cause variation it had been exhibiting. The control chart below shows what the BB was looking at.

Frequently Asked Questions (FAQ) about special cause
How can i determine if my variation is common or special cause.
The control chart is the tool used for distinguishing between common and special cause variation. If all your data points fall within your upper and lower control limits and behave randomly, you can conclude your process is exhibiting common cause variation. If not, then you have special cause variation.
Is special cause variation in a process bad?
It depends. Sometimes a special cause can result in an improvement in the process. You would then want to incorporate the change rather than eliminate it.
What should I do if my process shows special cause variation?
Your first action is to investigate to see if you can discover the reason or assignable cause of the unexpected variation, whether it be good or bad. Next, you should decide whether to eliminate or incorporate the reason depending on whether the process was made better or worse by the cause.
About the Author

Ken Feldman

Common Cause Variation Vs. Special Cause Variation
In the realm of process management and quality control, understanding the nuances between common cause variation and special cause variation is paramount. These concepts, rooted in statistical analysis and quality improvement methodologies, help organizations distinguish between routine fluctuations and exceptional events that require immediate attention. In this article, we delve into the essence of common cause and special cause variation, exploring their definitions, characteristics, implications, and strategies for management.
Defining Common Cause Variation
Common cause variation, also known as random variation or systemic variation, refers to the inherent variability present in a process. It represents the natural fluctuation that occurs when a system is operating under stable conditions. Common cause variation is expected and manageable within certain limits. It stems from factors that are inherent to the system itself and affects all outcomes uniformly.
Characteristics of Common Cause Variation
Common cause variation exhibits several key characteristics:
Stability : Processes experiencing common cause variation remain relatively stable over time, with variations clustering around the mean or average value.
Predictability : Variability caused by common factors follows a predictable pattern within established control limits. While fluctuations occur, they do not signify a significant departure from the norm.
Uniformity : Common cause variation affects the entire process uniformly, influencing all outcomes in a consistent manner.
Examples of Common Cause Variation
Common cause variation manifests in numerous contexts:
Manufacturing : In a production line, fluctuations in temperature or minor variations in raw material quality contribute to common cause variation.
Service Industry : In a call center environment, variations in call volume throughout the day or differences in customer demographics represent common cause variation.
Healthcare : In a hospital setting, fluctuations in patient arrival rates or differences in patient characteristics contribute to common cause variation in treatment processes.
Understanding Special Cause Variation
Special cause variation, also known as assignable cause variation, represents deviations from the expected or stable performance of a process. Unlike common cause variation, which is inherent and predictable, special cause variation arises from specific, identifiable factors that are not part of the normal operating conditions. These factors lead to significant shifts, outliers, or patterns in the data, signaling a departure from the standard behavior of the process.
Characteristics of Special Cause Variation
Special cause variation exhibits distinct characteristics that differentiate it from common cause variation:
Unpredictability : Special cause variation is unpredictable and sporadic, occurring infrequently and unexpectedly.
Non-uniformity : Unlike common cause variation, which affects the entire process uniformly, special cause variation may impact only specific parts or aspects of the process.
Identifiability : Special causes are identifiable and often traceable to specific events, conditions, or factors external to the system.
Examples of Special Cause Variation
Special cause variation can arise from various sources:
Equipment Failure : A sudden breakdown of machinery in a manufacturing facility leads to a spike in defects or production delays.
Human Error : Mistakes made by employees due to lack of training or oversight result in service failures or quality issues.
Supplier Problems : Delivery of defective raw materials by a supplier disrupts production processes and compromises product quality.
Managing Variation: Strategies and Tools
Effectively managing variation, whether common cause or special cause, is essential for optimizing processes and ensuring quality outcomes. Several strategies and tools aid organizations in this endeavor:
Statistical Process Control (SPC) : SPC involves monitoring and controlling processes through statistical analysis. Control charts, such as the X-bar chart and the individual/moving range chart, help distinguish between common cause and special cause variation, enabling proactive intervention when necessary.
Root Cause Analysis (RCA) : RCA is a systematic approach to identifying the underlying causes of problems or deviations from the norm. By identifying and addressing root causes, organizations can prevent the recurrence of special cause variation and improve overall process performance.
Continuous Improvement (CI) : CI methodologies, such as Lean Six Sigma, emphasize ongoing efforts to enhance processes and eliminate waste. By fostering a culture of continuous learning and improvement, organizations can mitigate common cause variation and drive sustainable performance gains.
Choose the Right Program
Unlock your project management potential with KnowMerit comprehensive training. Gain the skills and knowledge needed to lead successful projects, boost efficiency, and exceed goals. Choose the right project management course today and advance your career with confidence.
In conclusion, common cause variation and special cause variation represent two distinct types of variability present in processes. While common cause variation is inherent and predictable, special cause variation stems from specific, identifiable factors that lead to deviations from the norm. By understanding the characteristics, implications, and management strategies associated with each type of variation, organizations can optimize processes, enhance quality, and drive continuous improvement. Embracing these concepts empowers organizations to navigate the complexities of process management with clarity and precision, ultimately leading to better outcomes and increased competitiveness in today's dynamic business environment.
Recent Posts

The Best Python Certifications in 2024

Mastering the Top Power BI Skills for 2024

Top 15 Best Programming Languages To Learn in 2024

Advantages and Disadvantages of Artificial Intelligence [AI] 2024

Top 80 Node.js Interview Questions and Answers for 2024
- About knowmerit.com
- Who are we?
- Our Commitment
- Terms & Conditions
- Privacy Policy
- Refund Policy
- Contacts Us

KnowMerit is your premier destination for online tutoring services, offering expert live 1-on-1 learning for K-12 students across all subjects. Our dedicated team of experienced tutors employs a personalized approach and cutting-edge technology to cultivate an optimal learning environment for students to excel academically.
© 2023 KnowMerit. All rights reserved.
Common Cause vs. Special Cause Variations in Control Chart
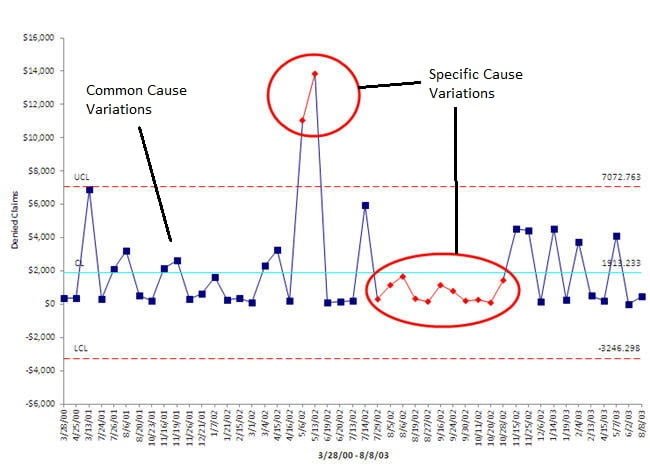
Project Quality Management – Control Chart – Common Cause vs. Special Cause Variations
Maintaining health of a process for continuously delivering quality product using control chart..
Whatsoever we are producing we see that our outcomes are not exactly identical. If we are producing any part of an automobile or a food product or anything else, we observe some variations. If the variation is very small, we may ignore it but variation still exist. These variations could be because of human errors or defect in a machine or error within acceptable precision in a machine, in the environment, changing temperature etc. Some of them may be acceptable to us as they are within our control limits but some may not be acceptable as they are categorized as defects.This concept is used in Control Chart to maintain the health of a process so that process always deliver quality product without any defect. It is also used in Six Sigma .
There are basically two types of causes that results into these variations. Common cause and specific cause. These terms are defined by Walter A. Shewhart and W. Edwards Deming .
Common cause variations is where combination of factors or no visible factor affected the process. It is a random variation while special cause variations are when one or more factors affected the process in a non-random way. Common causes are part and parcel of the process of production. Variations due to common causes are well expected and accepted. On the other side specific causes are unexpected. Specific causes produce variations which indicate error in the process and limit the capability of the process to deliver quality product. We cannot do much about common cause however special causes need to be identified and corrected for the process to continuously deliver quality product.
Common Cause variations
Common Cause variations are natural issues, noise within the process and random. Though variations are problems but as it is an inherent part of a process, it is expected. Variations due to common cause tells us that the process is healthy. Absence of variations due to common cause indicate some problem in the process.
Common causes examples: Vibration in industrial processes Ambient temperature and humidity Normal wear and tear
Attend PMP Prep Training and clear your PMP Certification Exam?
Click here to enroll yourself in next batch of PMP Certification Prep Training.
Special Causes variations
Special Cause variations are issues developed in a process. These variations were not observed previously and are unusual. They are some kind of defects in the system. Therefore special cause variations must be identified and resolved for the process to deliver quality products. Special cause variation arrives as a surprise as they are not expected and not welcome.
Special causes examples: Faulty controllers Machine malfunction Poor batch of raw material Power surges
Common cause variations are minor and caused by various environmental factors. They are random and well within accepted limits. Specific cause variations are caused by fault in the process. They may be within accepted limits but are big enough to suppress the randomness of common cause variations to generate a specific pattern. They are often used in control chart for early detection of fault in the process. If points in control chart lose its randomness and show a specific patter (rule of 7), it means process has developed a fault. This may be minor now (still producing product within accepted limits) but if remain unattended may start producing defective product (Out of acceptable limits). This may be major also which may produce product out of acceptable limits. In both the cases, process should be stopped and corrected before continuing.
Control Chart is one of the seven basic quality tools. PMBOK Guide lists these seven basic quality tool in tools and techniques for Project Quality Management. PMP Certification aspirants must understand these quality tools to prepare for PMP Exam. The concept of common cause and specific cause variations will help a PMP Aspirant to understand use of control chart in his/her study for PMP Exam. PMP Certification Training by pmwares covers all such concepts that are important for PMP Exam.
Leave a Reply Cancel reply
Your email address will not be published. Required fields are marked *
Save my name, email, and website in this browser for the next time I comment.
You may also like
Top 6 cost estimation methods in project management.
In project management cost estimation is a very important process in which we predict the financial resources required to execute a project. It involves carefully analyzing various cost factors like labor, materials, equipment, and other overhead expenses. This analysis can help you and other stakeholders to make informed decisions about project budget allocation and resource management.
LinkedIn Workplace Learning Report 2024: A Summary
The research conducted by LinkedIn shows that the top 5 learning and development focus areas for 2024 are aligning learning programs to business goals, upskilling employees, creating a culture of learning, helping employees develop their career and finally improving employee retention.
Role of Design Thinking in Project Management
While technical skills are often important for project managers, very few people think about creativity as an essential skill for them. If every project manager will use the same tools, softwares and methodologies, what will make their deliveries unique from others? You must have heard that the most beautiful designs often emerge from the messiest explorations. Similarly, the most creative solutions are given by the most curious minds.
- PMP Certification Training
- MS Project Training
- Project Management Fundamentals
- Advance Project Management Training
- Project Risk Management
- Primavera P6 PPM Training
- PRINCE2 Certification Training
- PgMP® Certification Training
- Leadership Development
- Software Projects Estimation
- Function Point Analysis Training
- Project Management Process
- Project Management Office (PMO)
- Enterprise Project Management (EPM)
- Troubled Projects Interventions
- Coaching & Mentoring
- The Project Management Webinar
- PMP Certification
- PMP Success Stories
- Function Point Analysis

Avoid Two Common Mistakes with a Shewhart Chart
Why it matters.
Leaders are frequently faced with having to improve results in their organizations. Without a method, they can fall prey to two big mistakes: 1) acting like something is a unique event when it’s normal for the process, or 2) ignoring issues that are truly special, assuming they are normal. Making the right assessment can be difficult without the right tool: a Shewhart chart, also known as a control chart.
Shewhart charts, which display data over time with upper and lower control limits, are the only way to differentiate between common (predictable) and special cause variation. Common cause variation is inherent in the process, while special cause variation is due to an attributable cause. On the chart, common cause variation falls between the upper and lower control limit, and special cause variation is found above or below it or when one of several rules exist (example, a run of either eight or more points above or below the mean). A good example is your commute time. Some variation has to do with the process itself, such as hitting a red or a green light. If something out of the ordinary happens, like a car crash, that’s special cause variation.

Phil Monroe, a current hospital board member, explained why he uses Shewhart charts on the Deming Institute’s podcast : “I need to understand, ‘Is this process predictable?’ If it isn’t, I want it to be. If it is, then I can consider whether I’m happy with it and whether a process improvement project makes sense. The best way to answer this is to get the last 20 data points and plot it on a Shewhart statistical process control chart.”
People often question whether they need as many as 20 points, because they don’t have the data, or they track monthly or quarterly data. In most cases, you can start a Shewhart Chart with 12 data points and create trial limits. The reason for 20-30 data points is that’s when you have enough data to have confidence in the control limits used for determining special cause. If that means going back historically, do it. If that means increasing the frequency of measurement to daily or weekly, do that. If you have no data, start now with a run chart . You’d rarely want to measure less often than monthly.
Understanding whether you have common cause versus special cause variation helps guide your actions. If your process is unpredictable, you want to figure out what’s causing that special cause variation and remove it from the system — for example, you might address equipment or procedure issues that are leading some people to do the work differently than others. If your process is predictable but you don’t like the current performance, you must change the process producing it to get different results.
A key first role of a leader is to foster reliable, predictable processes, and then decide whether you like the performance and make a plan to improve it.
Related Insights

- Lean Six Sigma
Special Cause Variation
Special Cause Variation, is a process anomaly that is induced by an unpredictable event. The image above depicts a Gaussian distribution, which depicts a natural distribution of points about a mean. When a process is operating normally, the curve above is the anticipated distribution of any critical process parameter that is under control.
When process control analysts witness such a trend, there is joy, for the process is stable. From a controls perspective, all that is primarily desired is for the system to be in control and capable. Variability is the enemy of quality.
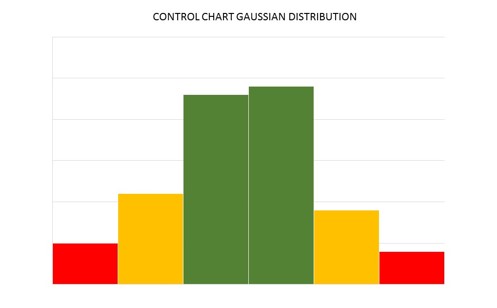
The SpaceX Falcon Heavy Rocket is the largest rocket to have left United States Territory since the late nineteen seventies. The SpaceX organization is on a mission to facilitate cheaper space exploration. Over time, they have been optimizing their rockets via improved designs. The organization started off via developing their Falcon 9 rockets, which consist of a base with nine merlin 1D engines. Loaded on top of the Falcon 9 is the standard payload, which is deployed once the rocket is in Lower Earth Orbit via a smaller Merlin vacuum engine.
Typical SpaceX flights, when observed, follow standard operating procedures. You can literally time with seconds precision, when blast off occurs, when main engines cut of, when the payload is deployed, and when the rocket cores return to Earth to land. It’s an interesting phenomenon to observe but it came via years of iteration. The SpaceX optimization process has included a myriad of failures, which the team has identified and tweaked. When a rocket has a failure the cause is often adverse.
The Falcon Heavy Rocket was the fusion of three Falcon 9 rockets. The primary objective of the recent inaugural test flight was to see if it was possible to fly such a large vessel. The two outer Falcon’s acted as boosters, while the center core carried the test payload to space.
As orchestrated, the Falcon Heavy gracefully flew to space. At lower earth orbit, the two side boosted successfully separated from the main core and returned to earth for a spectacular twin landing. The center core which is an identical unit to the other three, wasn’t so lucky. It crashed out at sea during its return to the Earth. The root cause, thanks to process data analysis, was a failure in the landing burn sequence. What caused this failure still hasn’t been revealed. This anomalous factor is what we call “Special Cause Variation”. It is random and unexpected.
The ingenious design of the Falcon Heavy Rockets is that the 9 Merlin 1 D engines throttle the unit through each stage of the flight and act as both engine and brakes. During blast off, all engines are in operation to facilitate the overcoming of the Earth’s gravitational field. Once in space, the engines cut off, and the rockets are drawn back to the Earth, where the gravitational field pulls the vessels towards it.
Where gravity acts, there’s acceleration, so the rockets are designed for controlled descent by ignition of three of the 9 engines. The generated exhaust gases create enough upthrust for a gentle landing. For the Falcon Heavy Center Core, only one Merlin 1 D Engine ignited during descent, and the unit accelerated to the Earth faster than anticipated and crashed out at sea. Why the other two engines didn’t ignite, is still under investigation. One rocket costs approximately $60 million dollars so the loss was relatively significant.
A detailed root cause analysis will be executed in order to identify what caused this abnormal occurrence, but it is clearly an observation that will have to be made and rectified before the units can be manned in the future. The rocket designers will think through each possibility on their quest to return their systems to normalcy.
Previous post: Sarah Model of Change
Next post: STRATEGY MANAGEMENT: Aligning the organization with the Strategy and Operations Planning
- 10 Things You Should Know About Six Sigma
- Famous Six Sigma People
- Six Sigma Software
Recent Posts
- Control System Expansion
- Energy Audit Management
- Industrial Project Management
- Network Diagram
- Supply Chain and Logistics
- Visual Management
- Utilizing Pareto Charts in Business Analysis
- Privacy Policy
Visit CI Central | Visit Our Continuous Improvement Store
- [email protected]
- 1-425-939-1604
> Lean Terms
Special Cause Variation
Last updated by Jeff Hajek on December 21, 2020
Special cause variation is one of the two main categories of variation. Common cause , the other type, is the consistent, recurring fluctuation within a system, sometimes referred to as “noise”.
Special cause variation, in layman’s terms, are the spikes that are caused by problems outside of those that regularly affect a process .

While most people look at special causes as being something different than common causes, in truth, the only real difference is mathematical.
What that means is that how a cause is categorized really has more to do with its magnitude and frequency rather than the actual underlying characteristics of the problem.
Take, for example, a glitch in a machine that causes it to drill holes incorrectly. If the glitch is frequent, it will show up as part of the natural fluctuation of a process. Statistically, that means that the variation is within a control limit that is defined by the standard deviation of a process.
Now, if that same glitch happened infrequently, and the process was stable relatively, it would fall outside of the control limit. It would then be categorized as a special cause.
In practice, though, special causes are good continuous improvement targets because they generally require unusual activities to deal with the problem. That disrupts flow . Responses to common causes, because they are more pervasive in the system, are generally managed by the normal process, and tend to be handled in stride.

Words of Warning
- Don’t fall into the trap that special causes are worse than common causes. The overall impact of common causes, because they happen regularly, can be much higher than that of special causes.
- Don’t categorize special causes by the type of issue that is occurring. Special cause variation is a function of where its impact falls relative to the ongoing performance of a process. If you eliminate one common cause, the standard deviation of a process will get smaller. That means that another common cause, if it falls outside of that tighter control limit, can suddenly become a special cause without anything about it changing.
Leave a Reply Cancel reply
Your email address will not be published. Required fields are marked *
Project Management Mastering Root Cause Analysis for Effective Problem Solving
Daily Jobs › Project Management
Mastering Root Cause Analysis for Effective Problem Solving

The first step in any problem-solving process is to identify the problem. It’s a daunting but necessary step that cannot be bypassed even if you don’t know how to solve the problem itself. One of the most effective ways to identify the problem is to conduct a root cause analysis. But what is a root cause analysis, exactly? In this article, we cover everything from root cause analysis and its approaches to how to conduct a root cause investigation effectively.
What Is Root Cause Analysis?

When faced with a problem, it can be tempting to only fix the immediate issue and move on as quickly as possible. But if you want to get to the bottom of things and avoid future problems, you need to conduct a root cause analysis. To even begin to understand the process, we first need to define root cause analysis.
❗ What is Root Cause Analysis ?
Root cause analysis is a systematic process for finding the real source of a problem.
Once you’re able to identify the root cause, you can put measures in place to prevent similar issues from happening in the future. You might be thinking,
Root cause example
An example of a root cause might be an IT system failing because someone didn’t update it when they were meant to. Another example is implementing training programs, career advancement paths, and mentorship initiatives to reduce employee turnover.
Once you’ve identified the problem, you can put measures in place to prevent it from happening again—this might involve changes to processes, procedures, or training. It could also require changes to equipment or materials, depending on the nature of the issue.
✅ The Advantages of Root Cause Analysis
There are several advantages to conducting a root cause analysis. When done correctly, root cause analysis can:
🔮 Prevent future problems Conducting a root cause analysis investigation can help organizations identify and correct the underlying causes of problems, preventing them from recurring in the future.
👨🏽🤝👨🏼 Improve team communication Conducting root cause analysis investigations can help to improve team members’ communication and help organizations better understand their customers’ needs.

⌛ Save time and money Root cause analyses can also save organizations time and money by preventing issues from reoccurring.
Everhour is the top choice for small businesses and small to mid-size teams of 5 to 50 members, including professionals like software developers, marketers, designers, consultants, lawyers, you name it!
Seamlessly integrating with popular project management tools like Asana, Trello, and Jira, its user-friendly interface and customizable reports make it the ultimate time tracking solution for small and mid-size teams.
With dedicated support ensuring you receive timely assistance, our team is here to help you promptly and with a smile!
💡 Foundation for continuous improvement Additionally, it can help organizations of all kinds build a foundation for continuous improvement by identifying opportunities for process improvements.
🤝 Promotes knowledge sharing Finally, root cause analyses promote learning and knowledge sharing within an organization by documenting the investigation process and findings.
As long as it is done properly, conducting root cause analysis investigations will help your organization solve problems, promote team communication, encourage knowledge sharing and save you precious time and money which can be spent improving other parts of the business.
❌ Drawbacks of Root Cause Analysis
There are several potential challenges associated with root cause analysis. For example, root cause analysis is:
🙅♀️ Time-consuming Root cause analysis investigations can be time-consuming and resource intensive, especially if you’re part of a small organization with a limited budget for such activities. Investigators need to have a good understanding of the problem and the systems involved in order to identify all possible causes.
🕵️♀️ Data access RCA often requires access to data that may be difficult to obtain. If the relevant data isn’t available to the investigators, the investigation may not be able to find the root causes of an issue.
🤹♀️ Multiple factors Another challenge with RCA is that it can be a challenge to identify the cause, often because multiple factors contribute to the issue. Additionally, changes in the system or environment can impact the results of an RCA investigation. For example, a change in the production process might eliminate a reported problem but, unfortunately, may introduce new ones that need to be tackled.

🤷♀️ Recommendations not implementable or meaningful Finally, RCA can sometimes lead to recommendations for changes that are difficult (or, in some cases, impossible) to implement. For example, the recommended changes may be too expensive or disruptive to implement fully, meaning the same issues may continue to occur. In other cases, investigators may not have enough information to make meaningful recommendations for change, limiting the effectiveness of a root cause analysis investigation.
Although root cause analysis has its advantages, in some cases, it may be met with roadblocks such as access to data, challenges identifying the cause due to lots of cause factors, and problems implementing meaningful change after the investigation closes.
Root Cause Analysis Approaches
The main goal of root cause analysis is to find out the source of a problem. But there’s not just one approach—there are several approaches to root cause analysis:

The 5 Whys is a popular approach to root cause analysis. It involves asking five successive questions about a problem in order to identify its root cause. For example, if a machine is not functioning as it should, the 5 Whys approach would involve asking five successive questions such as ‘why is the machine not working?’, ‘what is causing the machine to not work?’, ‘what are the consequences of the machine not working?’, and so on. By asking these questions, it should be possible to identify root causes and take the necessary steps to fix them.
One of the key advantages of the 5 Whys approach is that it is a relatively simple and straightforward way to identify the root causes of various problems. However, this specific approach may not always be successful in identifying root causes in all scenarios. For example, it may be necessary to ask more than five questions or use other approaches to define a root cause.
Fishbone Diagrams

Another popular root cause analysis (RCA) approach is to create a fishbone diagram. This approach helps investigation teams to visualize the relationships between different factors that may have contributed to a problem. They are also sometimes called cause and effect diagrams or Ishikawa diagrams, named after Kaoru Ishikawa, who developed this approach to root-cause analysis.
To create a fishbone diagram:
- Start by drawing a large bone shape on a piece of paper.
- Add branches coming off of the main bone, representing different factors that could have caused the problem.
- For each factor, ask why it may have contributed to the problem.
After adding a range of factors, you’ll likely soon find the source of the problem.
Fishbone diagrams have their advantages over some other root cause analysis approaches. For example, the technique is relatively straightforward, meaning it’s easy for those who’ve never encountered it before to learn how it works. On the other hand, for complex investigations, fishbone diagrams quickly become messy, and this may lead to confusion.
Change Analysis/Event Analysis

Another way to approach root cause analysis is with the change and event analysis method. Change analysis involves looking at how a system or process has changed over time, while event analysis focuses on understanding what happened during a specific incident.
Both approaches have their strengths and weaknesses, but change and event analysis can be used together to get a complete picture of exactly what caused a problem. So if you’re looking to solve a problem and prevent it from happening again, this might be the best method.
Change and event analysis is a great approach because it is conceptually simple, making it easy for those who haven’t encountered it before to grasp. However, it can be resource-intensive compared to other approaches because the results may not be conclusive, meaning investigation teams need to conduct time-consuming testing.
Pareto Charts
A Pareto chart is a simple graphical tool that is used to perform root cause analysis. The charts are useful for identifying the most important factors in a given situation, and they can help you prioritize actions and allocate resources effectively to save precious time and money.
To create a Pareto chart, you will first need to collect data on the different factors involved in the problem or issue you are investigating. Once you have this data, you can use it to create a bar chart with the different factors on the x-axis and their relative importance on the y-axis.

The most crucial factor is typically the one that contributes the most to the overall problem or issue. In most cases, this will probably be quite obvious. However, sometimes it may take time to determine which factor has caused the issue. In these cases, you can use the Pareto principle to help guide your analysis. The principle states that for most events, approximately 80% of the effects come from just 20% of the causes. This means that for many problems, most of the impact comes from a small number of contributing factors.
Applying this principle to root cause analysis can help you focus your attention on the factors with the biggest impact. This will be especially useful when dealing with a complex problem with many different contributing factors, but you have limited time or resources at your disposal.
Pareto charts are favored by many because problems are ranked in severity order, meaning it’s clear to all involved which issues need tackling first. Plus, these charts often provide a more complete explanation of a problem than other root cause analysis approaches. However, Pareto charts need good data to be effective. For this reason, they may not be suitable for teams that cannot access the data they require.
Failure Mode and Effect Analysis
Another potential approach is Failure Mode and Effect Analysis (FMEA), a tool used to identify possible failures in a system or process and determine the impact of those failures. This approach can also be used to develop corrective actions to prevent or mitigate the effects of the failures.
FMEA is typically performed during the design phase of a project, but it can also be used after a problem has occurred to help identify the root cause. When used in an investigation, FMEA can help identify all potential causes of a problem so that they can be explored further.
There are three steps involved in conducting an FMEA:
1. Identify potential failure modes: What could go wrong? 2. Determine the effect of each failure mode: What would be the consequences if this happened? 3. Prioritize corrective actions based on risk: What are the chances of this happening, and how severe would the consequences be?
Conducting an FMEA ensures that all potential causes of a problem are considered during an investigation and that corrective actions are prioritized based on the level of risk involved. This is beneficial because the investigation team can fix problems based on the severity level. However, this approach might not be suitable for all root cause analysis investigations because the method is only as good as the investigation team’s. For example, problems beyond the team’s knowledge may go undetected, meaning the root cause is never identified.
❓ How To Conduct a Root Cause Investigation
To conduct an effective root cause investigation, there are a few key things to be mindful of:
1️⃣ Establish a clear problem statement
First and foremost, it is vital to establish a clear and concise root cause problem statement—this will help to ensure that the investigation stays focused and on track. A vague problem statement may cause confusion and could drag the investigation out.
2️⃣ Work in a team
When it comes to conducting root cause analysis, you shouldn’t go it alone, if possible. Whether you’re working with one other colleague or an investigation team, more people will help you spot problems, challenge assumptions and figure out workable solutions.
3️⃣ Scrutinize (and improve) the process
This probably won’t be the last time you perform root cause analysis. So when you’re conducting the investigation, make sure to identify ways that you can improve the process for next time. Do you need a larger team? Should you pursue a different root cause analysis approach? The root cause problem-solving process won’t be perfect the first time!
4️⃣ Gather data
Gather as much relevant data as possible during root cause investigations. This data can come from a variety of sources, including interviews, observations, records, and documents.
5️⃣ Verify findings
Once potential root causes have been identified, they should be verified through additional testing and analysis to ensure the investigation team has found the true problem.
6️⃣ Make findings accessible
Once you’ve successfully identified the root cause of the problem, you should make the findings available to all those who might benefit from them. Your RCA analysis might help other colleagues solve problems in the future.
A variation of the process we outlined before can be seen in the picture below. Even though the steps may vary, all in all

Root cause analysis approaches may seem complicated when encountering them for the first time, but they are practical problem-solving tools that are helpful in various situations. The key to conducting an effective root cause analysis is to work as a team, ask the right questions, and use the information you gather to improve your processes over time. By following any of the approaches outlined above, you can run an effective root cause analysis investigation and help your business or organization avoid future problems.
Boost Productivity and Efficiency with Everhour
Everhour is a highly intuitive time tracker that facilitates accurate time tracking for easy client invoicing, careful project budgeting, and painless payroll. The time tracker provides users with several valuable features, including a handy time clock app that takes the work out of team management. Plus, Everhour offers a timesheet app , a work hours tracker , and an attendance tracker — employee time tracking and team management have never been easier!
Everhour offers several price plans, including a Free plan with unlimited time tracking, projects, and reports for up to five users. For those requiring more features, the Lite plan, billed annually, costs $5 per month per user and includes everything in the Free plan, plus up to 10 users, seamless integrations, reminders, invoicing, and budgeting capabilities. Finally, for those requiring an all-in-one solution, the Team plan, billed annually, costs $8.50 per month per user and includes everything in the Lite plan plus unlimited users, access to all integrations, and extensive time management features, expense tracking, scheduling, screenshots and much more!

Maria Kharlantseva
Search NAIC
Recommended.
Back to Newsroom
Consumer Insight

June 3, 2024
What Are Named Storm Deductibles?
Some insurance policies have a special deductible for losses caused by named storms, like hurricanes. The insurer applies this deductible only when a named storm causes damage. This deductible is separate and different from the normal deductible in a homeowners policy.
(A deductible is the amount you, the policyholder, owe before your insurance company starts paying its share of the loss.)
Here's what you should know about named storm deductibles.
How much are named storm deductibles? A named storm deductible is usually a percentage of the home’s value, making a policyholder responsible for a larger portion of a loss compared to their normal homeowners deductible.
Percentages can range from 1% to 10% of the value of the insured home. For example, if a homeowners policy has a 5% named storm deductible on a $300,000 house the policyholder would be responsible for paying $15,000 out of pocket. Named storm deductibles can also be a fixed dollar amount.
Read your policy to find out whether the deductible is per event, per season or per calendar year. If multiple named storms cause damage to your home during the coverage period, you may have to pay the deductible more than once.
Remeber that a higher deductible means a lower premium, but make sure you can afford the deductible if a claim arises.
How often would I have to pay a named storm deductible? Your deductible for named storms could be per event, per season, or per calendar year. Read your policy or talk to your insurance agent/company to understand which type you have.
When would I be covered? For the loss to be covered, it must be caused by a named storm. According to the Center for Insurance Policy and Research (CIPR), a hurricane deductible usually applies to damage from a National Weather Service (NWS) or National Hurricane Center (NHC) declared hurricane. Named storm deductibles can also apply to other NWS or NHC weather events, such as typhoons, tropical storms or tropical cyclones.
Are named storm deductibles common? Nineteen states and the District of Columbia currently have some form of hurricane or named storm deductible in place. These nineteen states are currently Alabama, Connecticut, Delaware, Florida, Georgia, Hawaii, Louisiana, Maine, Maryland, Massachusetts, Mississippi, New Jersey, New York, North Carolina, Pennsylvania, Rhode Island, South Carolina, Texas and Virginia. Other states may allow insurers to include hurricane deductibles in property insurance policies. Contact your state Department of Insurance with questions about your coverage or deductibles.
Where did named storm deductibles from from? Named storm deductibles first came about in 1992 after Hurricane Andrew. They became more common after Hurricane Katrina in 2005, when the insurance industry lost $64 billion.
Why do insurers use named storm deductibles? Hurricane and named storm deductibles allow insurers to provide coverage and manage the cost of premiums. Premiums are the set amount you pay each month to have an insurance policy.
Source: Hurricane Deductibles, CIPR
About the National Association of Insurance Commissioners
As part of our state-based system of insurance regulation in the United States, the National Association of Insurance Commissioners (NAIC) provides expertise, data, and analysis for insurance commissioners to effectively regulate the industry and protect consumers. The U.S. standard-setting organization is governed by the chief insurance regulators from the 50 states, the District of Columbia and five U.S. territories. Through the NAIC, state insurance regulators establish standards and best practices, conduct peer reviews, and coordinate regulatory oversight. NAIC staff supports these efforts and represents the collective views of state regulators domestically and internationally.
IMAGES
VIDEO
COMMENTS
The example of special cause variation in the manufacturing sector includes environment, materials, manpower, technology, equipment, and many more. In terms of manpower, imagine a new employee is recruited into the team and still lacking in experience. The coaching and instructions should be adapted to consider that the person needs more ...
Special-cause variation always arrives as a surprise. It is the signal within a system. Walter A. Shewhart originally used the term assignable cause. The term special-cause was coined by W. Edwards Deming. The Western Electric Company used the term unnatural pattern. Examples Common causes. Inappropriate procedures; Poor design; Poor ...
Special cause variations are unexpected glitches that occur that significantly affect a process. It is also known as "assignable cause." ... One example of a special cause variation would be a task taking exorbitantly longer than typical due to an unexpected crisis. Other examples would be power outages, computer crashes, and machine ...
A cycle or repeating pattern. A run: 8 or more points on either side of the average. A special cause of variation is assignable to a defect, fault, mistake, delay, breakdown, accident, and/or shortage in the process. When special causes are present, process quality is unpredictable. Special causes are a signal for you to act to make the process ...
The malfunction is an example of a special cause variation. 3 best practices when thinking about special cause variations. Here are a few practices to bear in mind when it comes to special cause variations: 1. Countering special cause variations. Contingency plans can be used to counter special cause variations.
Common Cause Variation. Common Cause Variation, also referred to as "Natural Problems, "Noise," and "Random Cause" was a term coined by Harry Alpert in 1947. Common causes of variance are the usual quantifiable and historical variations in a system that are natural. Though variance is a problem, it is an inherent part of a process ...
By quickly detecting special cause variation, improvement teams can more readily assess the impact of interventions by validating whether their hypothesis for improvement is correct. An example of special cause variation can be seen in the OA's Fig 2, noted by the shift in the centerline in May 2018 from a baseline of 70% of problem lists ...
Special cause variation refers to fluctuations in a process that happen because of unique or unusual factors that are not normally present. These unnatural variations are unpredictable and assignable to a specific cause. They indicate that the process has become unstable and is producing defects or undesirable outcomes.
Special causes variability is beyond the natural variability of the process. Special cause variability can be identified and addressed by operators. Examples of special causes are operator error, faulty setup, or incoming defective raw material. Deming believed that only about 15% of the variation in a process is due to special causes.
Some degree of variation will naturally occur in any process. Common-cause variation is the natural or expected variation in a process. Special-cause variation is unexpected variation that results from unusual occurrences. It is important to identify and try to eliminate special-cause variation. Out-of-control points and nonrandom patterns on a ...
A fundamental concept in improvement science is understanding the difference between common cause and special cause variation. By understanding how to apply these concepts to your data, you will more quickly identify when a change has occurred and whether action should be taken. The authors' SPC charts reveal examples of both common cause and ...
In the world of statistics and quality control, understanding the concepts of common cause and special cause variation is vital for making informed decisions and improving processes. Common cause variation is the inherent, expected variation in a process, while special cause variation represents unusual and identifiable sources of variability.
Special causes may change important process parameters that reduce the inherent common cause variation within a process. This is referred to as the Hawthorne Effect - named after a research study conducted in Hawthorne, Illinois. In this study of worker productivity, it was determined that the primary influence on worker productivity was the ...
Common causes are also called natural causes, noise, non-assignable and random causes. Special cause variation, on the other hand, is the unexpected variation in the process. There is a specific cause that can be assigned to the variation. For that reason, this is also called as the assignable cause. You are required to take action to address ...
Staff — January 4, 2013. Common-cause variation is where no one, or combination of factors is unduly affected the process variation (random variation). Special-cause variation is when one or more factors are affecting the process variation in a non-random way. With special-cause variation, one should be able to identify, or put their finger ...
Here are some examples of Special Causes of Variation: an equipment malfunction causes occasional spikes in the size of holes drilled; an out-of-stock condition causes a customer order to be delayed; vibration from a passing train causes a chemical reaction to speed up; a temporarily opened window causes the temperature to drop; an untrained ...
Variations are of two types: Common Cause variation and Special Cause Variation. Both types play a significant role that helps determine the stability and performance of processes. In this blog, we will explain the key differences between the two types of variation with the help of real-world examples for a better understanding.
An industry example of special cause. The company's Six Sigma Black Belt (BB) was helping the manufacturing manager monitor his machine setup time with a control chart. He noticed that at point 65, an upward trend of consecutively increasing times began. This was shown as a series of increasing red data points.
Unpredictability: Special cause variation is unpredictable and sporadic, occurring infrequently and unexpectedly. Non-uniformity: Unlike common cause variation, which affects the entire process uniformly, special cause variation may impact only specific parts or aspects of the process. Identifiability: Special causes are identifiable and often ...
Special causes examples: Faulty controllers Machine malfunction Poor batch of raw material Power surges. Common cause variations are minor and caused by various environmental factors. They are random and well within accepted limits. Specific cause variations are caused by fault in the process. They may be within accepted limits but are big ...
Common cause variation is inherent in the process, while special cause variation is due to an attributable cause. On the chart, common cause variation falls between the upper and lower control limit, and special cause variation is found above or below it or when one of several rules exist (example, a run of either eight or more points above or ...
The perfect example of a special cause variation is in the case of the failure of the SpaceX Falcon Heavy Rocket's Center Core. The SpaceX Falcon Heavy Rocket is the largest rocket to have left United States Territory since the late nineteen seventies. The SpaceX organization is on a mission to facilitate cheaper space exploration.
Special cause variation is one of the two main categories of variation. Common cause, the other type, is the consistent, recurring fluctuation within a system, sometimes referred to as "noise". Special cause variation, in layman's terms, are the spikes that are caused by problems outside of those that regularly affect a process.
For example, root cause analysis is: 🙅♀️ Time-consuming Root cause analysis investigations can be time-consuming and resource intensive, especially if you're part of a small organization with a limited budget for such activities. Investigators need to have a good understanding of the problem and the systems involved in order to ...
Probable Cause To Search Person or Property. Probable cause to search exists when facts and circumstances known to the law enforcement officer provide the basis for a reasonable person to believe that they committed a crime at the place to be searched or that evidence of a crime exists at the location. The police officer can then seek a search ...
Some insurance policies have a special deductible for losses caused by named storms. The insurer applies this deductible only when a named storm causes damage. This deductible is separate and different from the normal deductible in a homeowners policy. A deductible is the amount you, the policyholder, owe before your insurance company starts paying its share of the loss.
NEW YORK, GENEVA, 28 May 2024 - Around the world, menstrual health and hygiene needs are being overlooked due to limited access to information, education, products and services, as well as inadequate facilities and inequalities. A new report, Progress on drinking water, sanitation, and hygiene in schools 2015-2023: special focus on menstrual health, launched by UNICEF and WHO on Menstrual ...